


If there are any investors still wondering how vicious the selloff in health care stocks has been over the past couple of weeks, the charts below are worth 1,000 words.
But there is a silver lining: Sometimes a sector or stock can perform so badly, that it can be a good thing.
The SPDR Health Care Select Sector exchange-traded fund XLV, +0.16% closed Thursday, after swinging from an intraday loss of as much as 1.3% to a gain of as much as 0.8%. The ETF (XLV) has lost 0.7% year to date, making it the only SPDR ETF tracking the S&P 500’s 11 sectors to be down this year, amid increased political rhetoric regarding “Medicare for All” plans and lower drug prices. In contrast, the S&P 500 index SPX, +0.16% has surged 15.9% this year.
Don’t miss: Health-care stocks keep getting hammered—Wall Street says this is why.
On a relative-strength chart, which compares the XLV’s performance relative to the S&P 500, the XLV hit a six-year low Thursday.
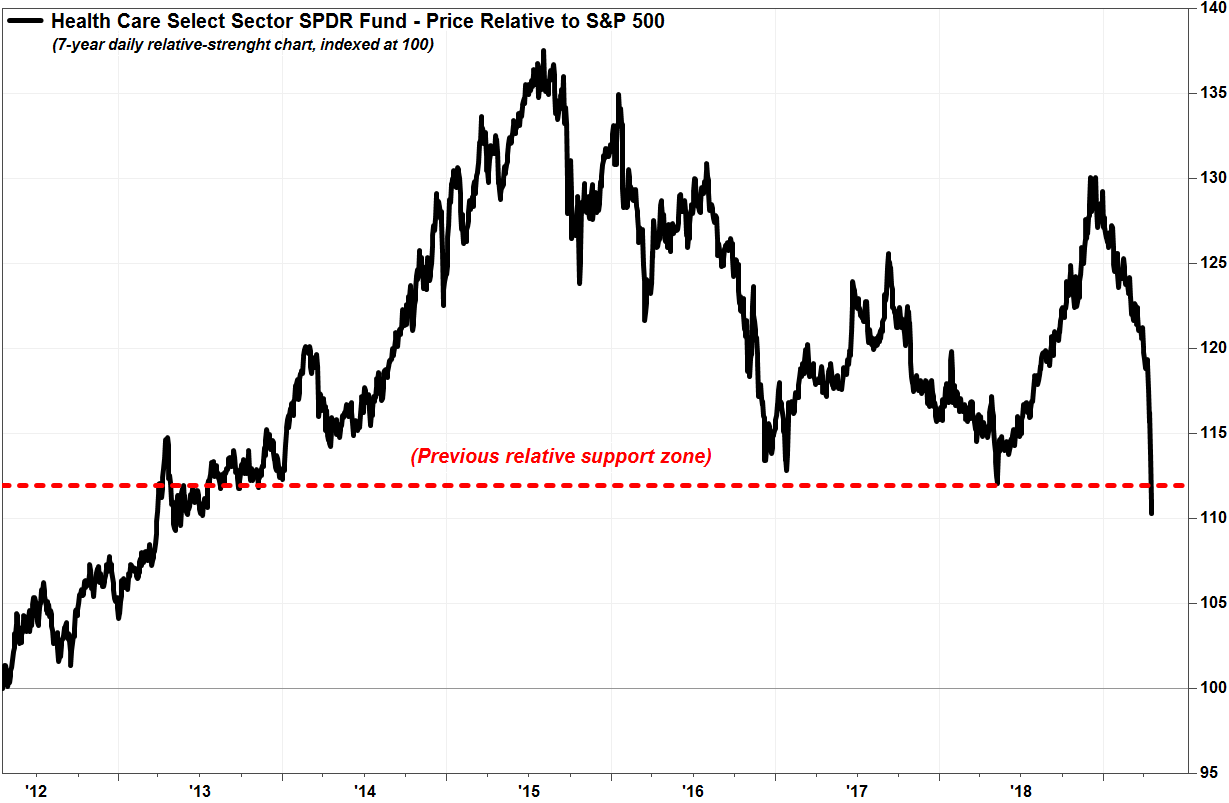 FactSet, MarketWatch
In terms of historical volatility, the selloff has been the most abrupt since the “flash crash” of late-August 2015, when the XLV plummeted as much as 21% intraday, with most of that selloff occurring in a matter of seconds, before bouncing to close down 4.3%.
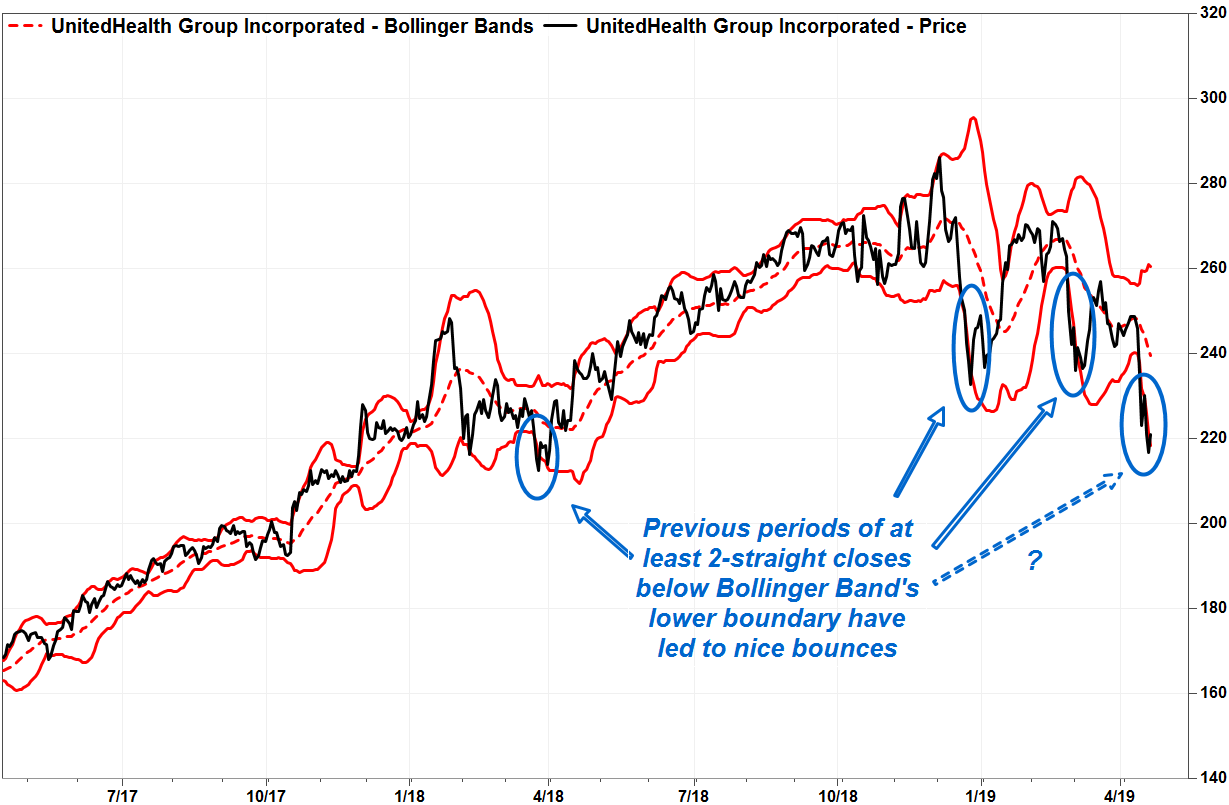
To illustrate this, Bollinger Bands were used. That technical tool, developed by John Bollinger in the early 1980s, consists of a 20-day moving average line and boundary lines that are two standard deviations above and below the moving average line. Read more about Bollinger Bands.
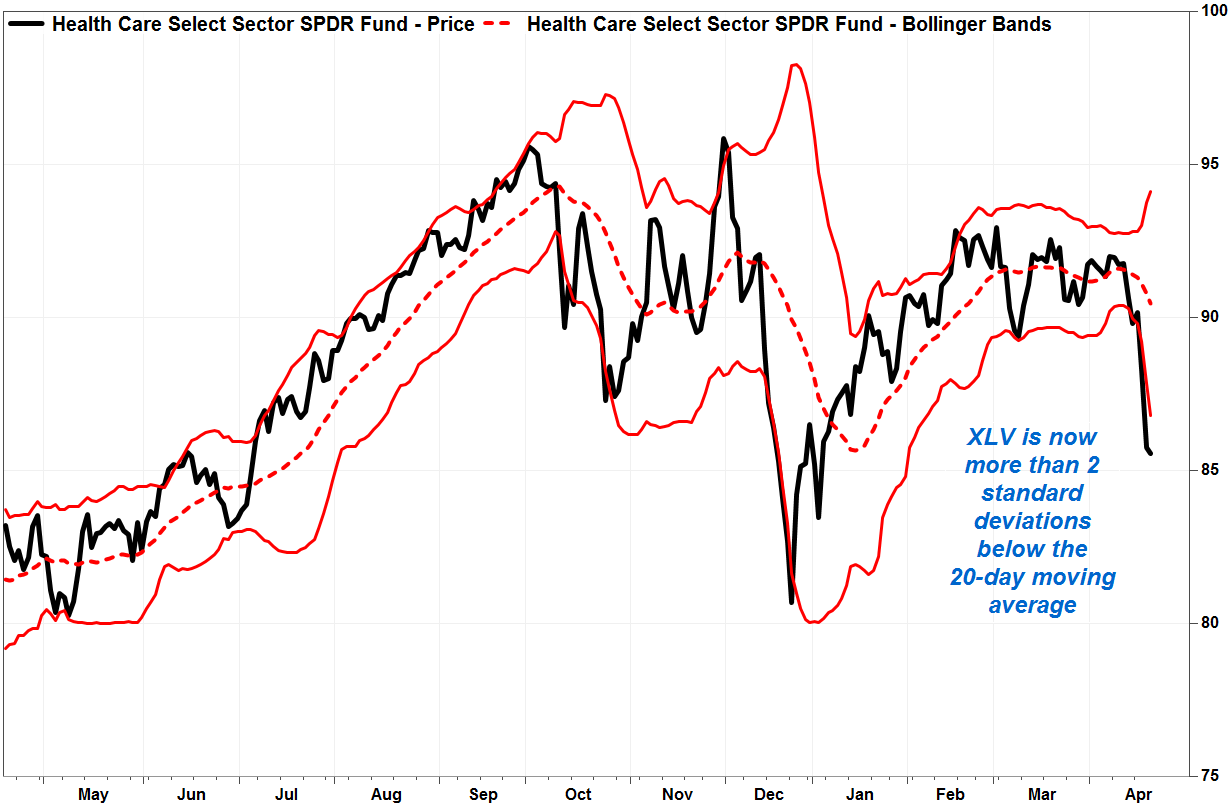 FactSet, MarketWatch
The XLV is 1.16% below the lower boundary line, after being 2.36% below it on Wednesday, which a level not seen since Aug. 24, when it was 2.85% below the line.
The same goes for UnitedHealth Group Inc.’s stock UNH, +2.26% which has lost 13.8% over the past month to be the second-worst performing Dow Jones Industrial Average DJIA, +0.42% component over that time, trailing only the 14.3% drop in Walgreens Boots Alliance Inc. WBA, -0.92% shares. Read more about how the health care selloff is spreading.
UnitedHealth’s stock tumbled to a one-year low on Wednesday, after chief executive, David Wichmann expressed disdain for, but at the same time acknowledged the threat, of “Medicare for All,” possibly fueling fears.
Also read: UnitedHealth stock falls despite earnings beat, signaling investor jitters over ‘Medicare for All.’
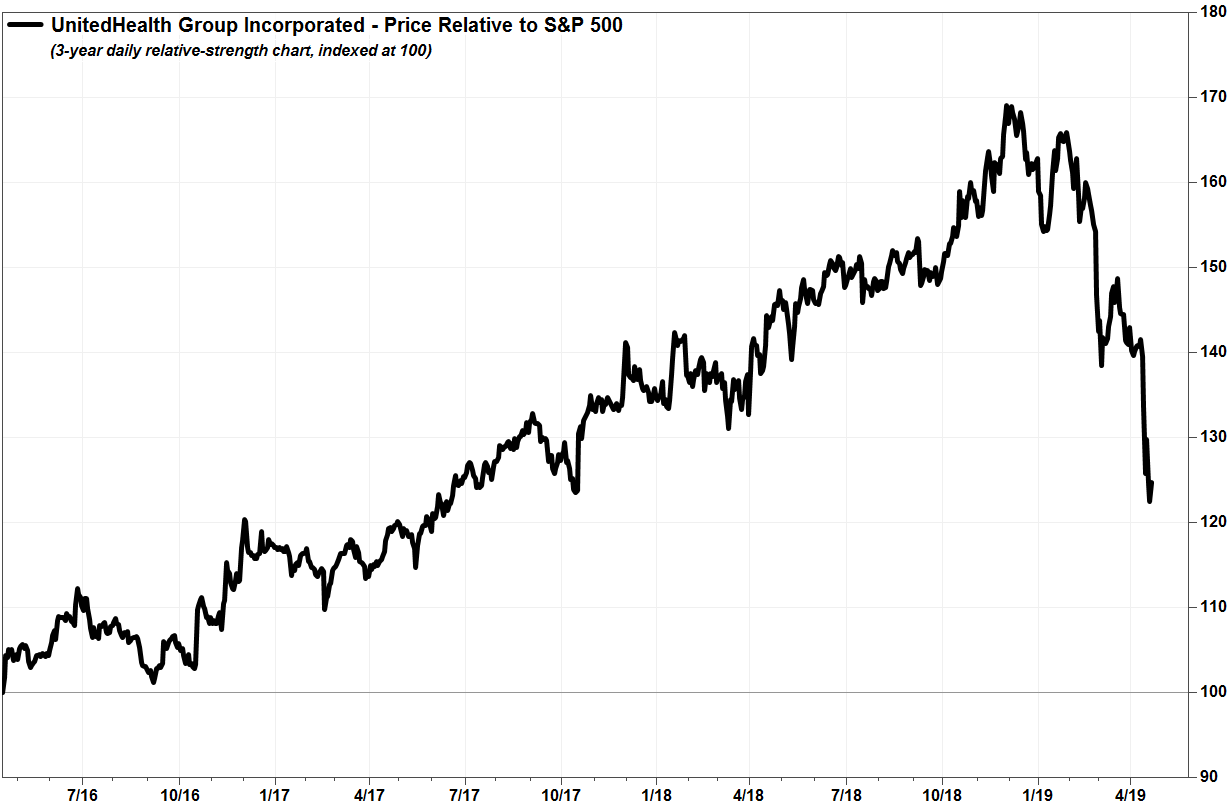 FactSet, MarketWatch
The stock fell to a 2-year low relative to the S&P 500, and closed as much as 3.78% below its lower Bollinger Band line last Friday, the biggest spread since it closed 3.96% below its lower boundary line on Aug. 24, 2015, and 2.18% below the line on Tuesday.
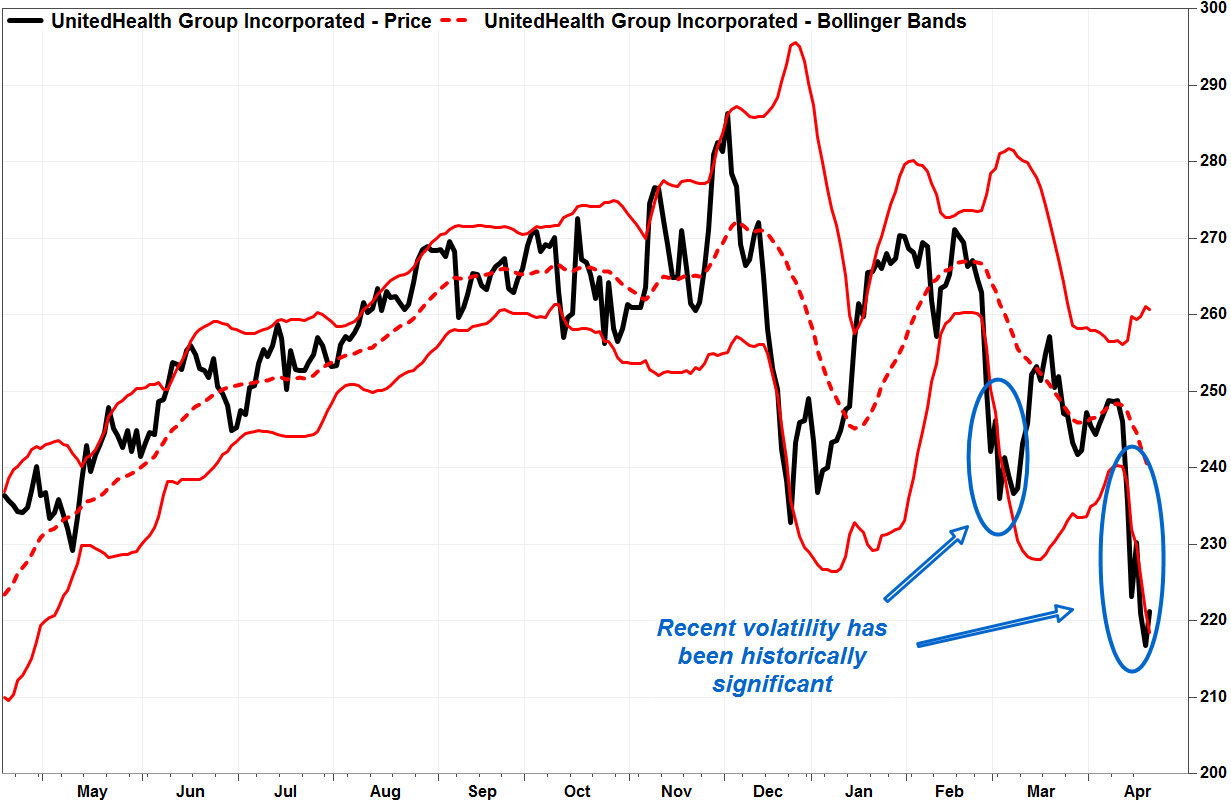 FactSet, MarketWatch
Now the good news
There is a bright side to all this dreariness.
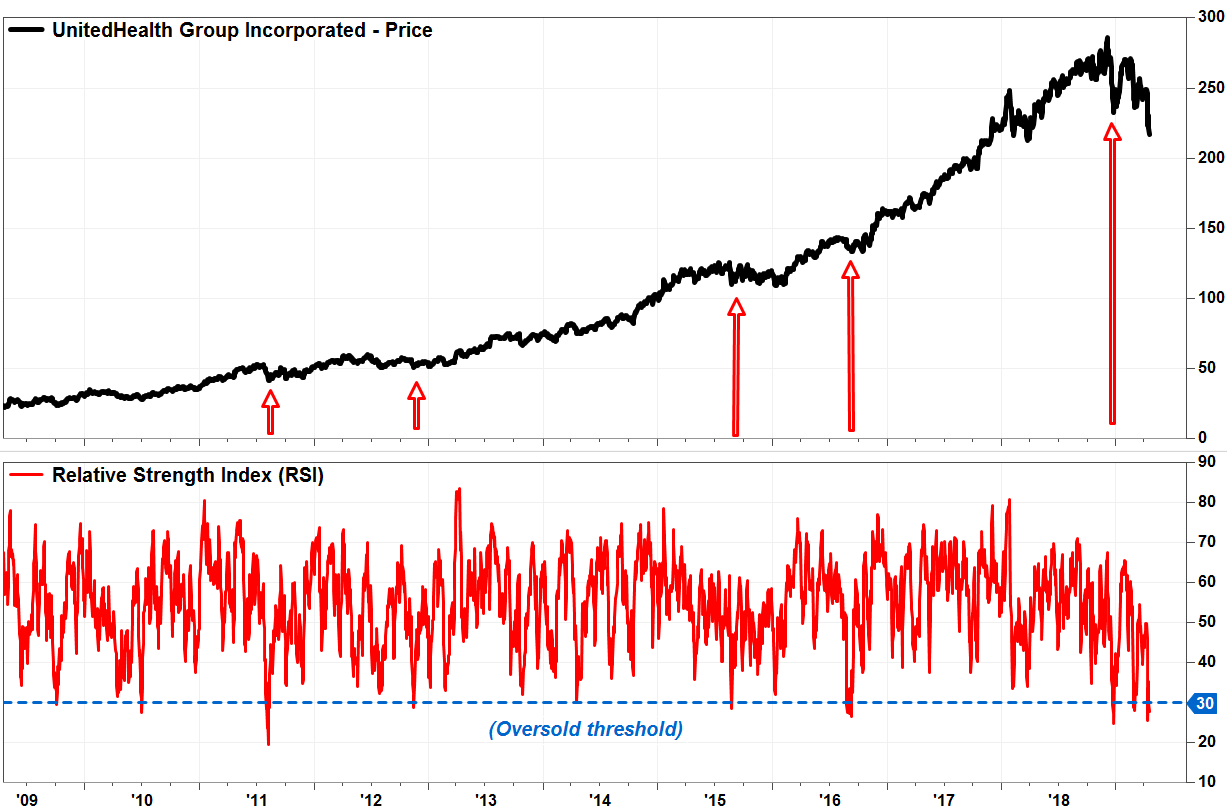
On the XLV’s relative-strength chart, Instinet executive director and technical analyst Frank Cappelleri said the weekly Relative Strength Index (RSI), which tracks how the magnitude of recent gains compares with the magnitude of recent declines, has hit its lowest level in the XLV’s 20-year history.
That suggests an extreme oversold condition, which is viewed by many as a contrarian indicator—the more “oversold” something is, the more likely a bounce becomes.
Cappelleri said previous occasions when the RSI hit the “oversold” threshold “eventually led to positive reversals; some were short, some led to longer periods of outperformance.”
And in previous periods when the XLV closed below the lower Bollinger Band line, a bounce ensued, some were short, and some swung all the way up to the upper boundary in relatively short order.
The same goes for UnitedHealth’s chart. The RSI recently hit among the most oversold levels in the past eight years.
 FactSet, MarketWatch
Previous periods of multiple closes below the lower Bollinger Band line almost always led to a nice bounce, some which were short, but some were fairly significant and lasted a long time.
 FactSet, MarketWatch
Has that bounce already started? UnitedHealth’s stock surged 2.3% on Thursday, reversing an earlier intraday loss of as much as 1.2%.


