


Stocks are pricey but so are bonds and gold. Even bitcoin has caught a bid after a months long fallow period recently, giving way to a powerful burst higher.
That dynamic has left many investors, strategists and other Wall Street watchers wrestling with some tough questions: What to buy if everything is trading at a relative premium to historic averages and the swiftly changing narrative on trade or the economy could ignite stomach-churning price swings?
And if it feels like the recent tandem asset run-up has the markets on a knives edge, it may be for a good reason. “Things can quickly change on a dime from a [Federal Reserve] perspective, from a trade perspective,” Lindsey Bell, investment strategist at CFRA, told MarketWatch in a recent interview.
The S&P 500 price-to-earnings — a popular way of valuing stocks — on a trailing 12-month basis is at 21.83, compared with a 10-year average of 17.87, according to Dow Jones Market Data. That means the combined price of the constituents of the index was almost 22 times the net earnings produced over the past year. The historical mean is 15.75.
If investors find those valuations rich, so-called haven investments also are pricey. Gold prices GCQ19, -0.08% for example, which don’t normally rally alongside assets perceived as risky like stocks, finished not far from their highest level in six-years on Friday at $1,413.70 an ounce, based on the most-active futures contract. That is higher than the one-year ($1,264.87/oz.), five-year ($1,243.19/oz.) and 10-year averages ($1,324.85).
The 10-year Treasury note yield TMUBMUSD10Y, +0.00% finished last week’s trade at 2%, about half-a-percentage point below the 10-year average for the benchmark bond at 2.482% — briefly dipping beneath that level to mark a nearly three-year nadir.
Outside of those widely followed instruments, bitcoin BTCUSD, -6.80% is trading at around $12,000, despite an end-of-the-week stumble, well above its average over the past three years at $5,253.56.
And a measure of the stock-market turbulence also is relatively richly priced. The Cboe Volatility Index VIX, -4.68% also known by its ticker symbol VIX, typically rises when stocks fall and for that reason is a common way to hedge against market slumps, stands at 15.08, not far from its five-year average at 15.08 or the 10-year average at 17.34.
The curious state of affairs in the investing landscape is one that some strategists argue is the byproduct of global central bankers who are struggling to sustain a decades-old recovery.
The Federal Reserve is considering easing monetary policy after a series of interest-rate increases that began at the end of 2015. Fed Chairman Jerome Powell has said “cross currents” from a dispute over trade policy and import tariffs between China and the U.S. is at least partly the justification for lowering borrowing costs again. The European Central Bank is similarly considering restarting measures to stimulate the eurozone’s economy.
One possible consequence of this monetary easing is some $13 trillion in government debt that offers yields below zero, meaning that lenders can expect to recover less than their original investments from sovereign borrowers.
“I think one of the unintended, yet in hindsight predictable, outcomes of ZIRP [zero interest-rate policy] was to force investors into looking for returns anywhere they can find it,” Michael Antonelli, a market strategist at Baird, told MarketWatch.
“Stocks, gold, real estate, even the burgeoning world of crypto-currencies, if you offer zero or negative interest rates on an ever increasing amount of ‘safe’ government debt then investing behavior will be altered,” he said.
On Friday, the Dow Jones Industrial Average DJIA, +0.28% put in its best June return since 1938, the S&P 500 index SPX, +0.58% notched the best such gain since 1955, and the Nasdaq Composite Index COMP, +0.48% marked its best June since 2000, even as those benchmarks logged weekly losses amid uncertainties over trade policy ahead of the closely watched G-20 meeting in Osaka, Japan on Saturday.
Antonelli said a “great many assets” are “rich” compared against historical valuations, adding that “whether that unravels at some point only time will tell but the behavior of it seems very human to me.”
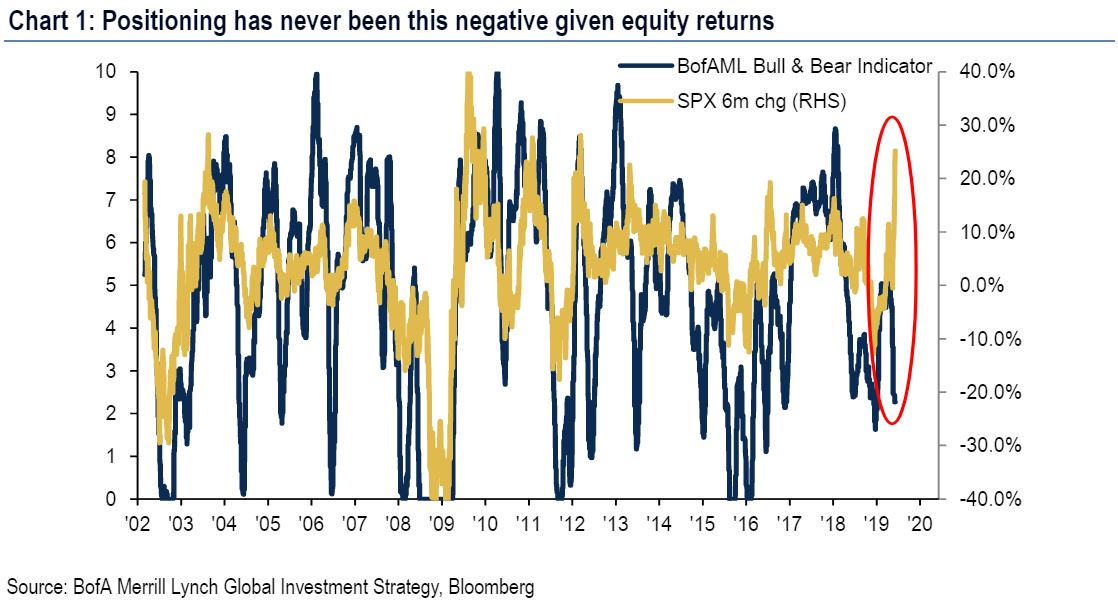
Still, investors are clearly uneasy. Bank of America Merrill Lynch analysts led by Michael Hartnett, chief investment strategist, say that investors have never been so negative on a market that is rallying so briskly (see chart below):
Perhaps, the biggest risk of the rally in assets across the board is, as CFRA’s Bell says, the narrative can change swiftly and assets that don’t tend usually move in lockstep can revert to their normal levels and correlations, potentially bruising investors’ wallets.
On Saturday overnight, U.S. President Donald Trump and China’s President Xi Jinping agreed to a cease-fire in their yearlong trade war, averting an escalation in potentially market-rattling tensions, but a substantive deal is far from certaint and volatility is the likely reality in the near-term even as talks resume.
Read: Kyle Bass says Wall Street investors should ignore G-20 and brace for a fresh round of Trump tariffs
So what’s an investor to do against that backdrop?
Bell says a balanced, diversified investment portfolio is the answer. The strategist recommends an allocation of 55% in stocks (15% of that in foreign equities) 25% in bonds, 15% in cash, and a 5% allocation to gold. “You have to a carefully crafted portfolio,” she said.
Looking ahead:
It’s a holiday-shortened week, with U.S. markets closed in observance of Independence Day on Thursday, July 4.
JOBS, JOBS JOBS: Investors will watch for the most important labor-market report since the last one. The Labor Department’s nonfarm-payroll report for June comes after job growth of 75,000 in May, well below estimates of 185,000. Economists’ consensus estimates for June is for the creation of 170,000 jobs and an unemployment rate holding at 3.6%. The report is due at 8:30 a.m. Eastern Time.
Monday
A gauge of manufacturing activity for June is due at 9:45 a.m., with the more closely watched read from ISM at 10 a.m. Data on construction spending also is due on that day at the same time.
Wednesday
A read on private-sector employment from ADP is due at 8:15 a.m. ET, with a reading of weekly jobless claims to follow at 8:30 a.m., a day earlier than usual because of the Fourth of July holiday, along with a trade-deficit report. At 9:45 a.m., IHS Markit services service-sector report, followed by ISM’s non-manufacturing gauge at 10 a.m., as well as a report on factory orders at the same time.


