


Where is this dazzling bull market headed in the coming days and weeks?
That is the trillion-dollar question some nervous strategists, analysts and traders are wrestling with, following a relatively brisk rally for equities to kick off 2020.
So far, major indexes have checked all the boxes for the bulls. The Dow Jones Industrial Average DJIA, +0.17% traversed a milestone at 29,000, the S&P 500 index SPX, +0.39% followed with its own landmark turn above 3,300 and the Nasdaq Composite Index COMP, +0.34% is rallying like it is 1999. And that’s all within the first 11 trading days of 2020, in which the Nasdaq (and the S&P 500) have closed at all-time highs more than half the time.
Another way to think about, the ferocity by which stocks have climbed in the first three weeks of this year, S&P 500 gains have already exceeded the 2020 estimates for nearly half the 18 analysts surveyed by MarketWatch.
Part of the euphoria has been stoked by the apparent détente between China and the U.S., cemented by the signing on Wednesday of the first stage of a trade resolution between Beijing and Washington. The other factor keeping equities afloat is undoubtedly a Federal Reserve that slashed interest rates thrice last year to a 1.75%-2% range and have markets under the impression that a low-rate regime is here to stay to for the foreseeable future.
Read: The S&P 500 is now more overvalued than ever, per this measure
“We stay irrationally bullish until peak positioning & peak liquidity incite [a] spike in bond yields & 4-8% equity correction,” wrote analysts at Banc of America Securities on Friday in a weekly research report on the state of the market.
However, even bulls know that stock markets don’t rally indefinitely.
“To date the market has had a long run of prosperity that makes investors nervous, because we all have good memories that what goes up must come down,” Art Hogan, chief market strategist at National Securities Corporation, told MarketWatch.
And for some there is plenty of reason to believe that this year could be one replete with volatility shocks along the way?
For one, some 87% of the components of the S&P 500 are trading above their 200-day moving average, used by technical analysts to help gauge bullish and bearish long-term momentum in an asset (see chart below):
 Source:Instinet
 “That is the highest mark since July, 2014. And July 3, 2014 was the last time there were 90%. That lasted for a day,” Frank Cappelleri, executive director of equity sales and trading at Instinet, told MarketWatch on Friday.
Meanwhile, a measure of how intensely the market has been bought is showing the highest reading since January of 2018. The relative strength index, or RSI, over a rolling 14-day period was at 76.91 on Friday and had touched 78.27 on Dec. 27, marking the highest reading since Jan. 26, 2018 (see chart attached). Traditionally, the RSI, which charts the speed of price changes in an asset, oscillates between 0 and 100 and is considered overbought when it reads above 70 and oversold when below 30:
Thus far gains have pushed stock prices up without the commensurate advance in corporate earnings. Indeed stocks are overvalued according to the popular measure of price-to-earnings, or P/E, which compares the price of one share of stock against one year of per-share earnings relative to recent history. By that measure, the S&P 500 is trading at 18.6 times for the coming 12 months, according to FactSet data. That is above the average ratio of 16.7 during the past five years and 14.9 over the past 10, MarketWatch’s Chris Matthews reports.
Perhaps, that’s why corporate earnings reports may take on added significance this week and next as the issues of Sino-American trade spats have shifted to the back burner and interest rates remain anchored lower.
So far this quarter earnings could help provide a further lift to stocks if companies manage to beat already-lowered market expectations.
MarketWatch’s Tomi Kilgore reports that there’s a chance earnings growth could end up better than feared, “as analysts have been more pessimistic than usual, amid uncertainty over the negative impact from U.S.-China trade tensions and slowing overseas growth.” That would end an earnings recession, which S&P 500 index companies entered officially for the first time in three years back in September.
In all, 70.5% of the 9% of S&P 500 companies that have reported earnings so far have beaten expectations, according to Refinitiv, above the beat rate of 65% for a typical quarter.
Next week’s holiday-shortened U.S. week begins a more intense phase of fourth-quarter earnings reporting which could help determine the fate of this bull market, at least in the near term.
If quarterly results can help support this rally then investors may want to heed the advice of hedge-fund luminary David Tepper and ride “a horse that’s running”
“The market we’re in is one that grinds higher or steadily creeps higher, it is doesn’t give investors a chance to buy pullbacks,” Paul Schatz, president of Heritage Capital, told MarketWatch. He said that’s one of the reasons that FOMO, or fear of missing out, seems to have taken hold on Wall Street.
How close are we to getting a pullback? Who knows?
“Indicators don’t flash red when the market is at a top,” writes Mark Newton, a prominent. independent technical analyst. “It’s hard to go out there and really trumpet a big bearish call, which makes you wonder if its probably the right thing to be doing.”
Or as Jim Carney, founder and CEO of alternative investment manager Parplus Partners, told MarketWatch: “It’s a tough one, You’ve got these guys on TV saying all systems are go, there is no stress in the market and I can’t see what the next problem is going to be on the horizon.”
“But every time, it looks good something happens…it’s almost frightening and that’s when it gets worrying,” he said.
Investors were skittish enough to help produce record flows into bonds, according to Bank of America which indicates that the past two weeks of purchases, about $40 billion, suggest an annualized pace of bond buying of around $1 trillion (see attached chart). Maybe that’s why the 10-year Treasury note TMUBMUSD10Y, +0.00% yield has been anchored at a range between 1.71 and 1.95% in January.
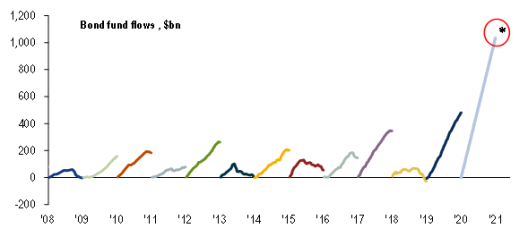 Source: B. of A.
 With all that in mind, let’s take a look at what’s ahead with U.S. markets closed on Monday in observance of Martin Luther King Jr. Day:
Earnings highlights
Tuesday: Halliburton Co. HAL, +0.63% Netflix NFLX, +0.31%, and International Business Machines Corp. IBM, +0.24%.
Wednesday: Johnson & Johnson JNJ, +0.65%, Baker Hughes Co. BKR, +0.43%, Abbott Laboratories ABT, +0.82%, United Airlines Holdings Inc. UAL, +0.18%, and Citrix Systems Inc. CTXS, +0.29% Texas Instruments Inc. TXN, +1.18% and Kinder Morgan Inc. KMI, -0.05% after the bell.
THURSDAY: Dow components Procter & Gamble Co. PG, +0.27%, Travelers Cos. Inc. TRV, +1.35% and Intel Corp. INTC, -0.10% and American Airlines Group Inc. AAL, +0.60%, Southwest Airlines Co. LUV, -0.52% and E-Trade Financial ETFC, +0.39% and Union Pacific Corp. UNP, +0.77%.
Friday: American Express AXP, +0.74% Synchrony Financial SYF, +0.79% NextEra Energy Inc. NEE, +0.45% and Air Products & Chemicals Inc. APD, +0.52%
Economic reports
Wednesday: Chicago Fed National Activity index at 8:30 a.m. ET, FHFA home price index at 9 a.m., pending home sales and exiting home sales at 10 a.m.
Thursday: Jobless claims at 8:30 a.m., leading indicators at 10 a.m., and Kansas City Fed manufacturing at 11 a.m.
Friday: Flash composite PMIs services and manufacturing at 9:45 a.m.


