


The S&P 500 index broke out to new all-time highs on Monday and confirmed the breakout by continuing to close above the previous all-time highs (3028) for the next two days. The upside breakout created a small gap on the chart, which was bullishly filled on Wednesday, just before the market surged even higher.
This brings the S&P SPX, -0.53% chart into a “bullish” status and puts it in line with our other indicators, which have been bullish for some time now.
There is now support at the previous all-time highs — in the 3025-3030 area. If the S&P were to close below there, it would be disappointing for the bulls, but not necessarily a deal breaker. The next support area, however, is at 2950, which is where the very bullish gap exists for SPX (red circle on this chart). A close below there would be quite bearish.
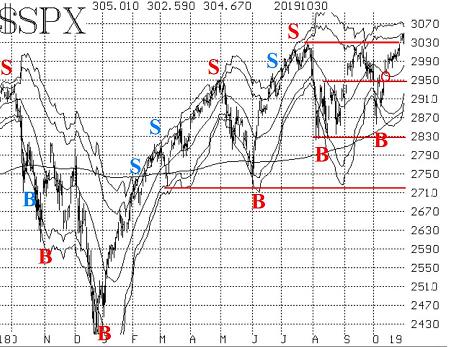
Meanwhile, the “modified Bollinger Bands” (mBB) have begun to contract, even while SPX is rising, because volatility is collapsing. The previous mBB buy signal of Oct. 4 is still in effect. Ideally, that buy signal would have a target of the +4σ Band, which is at 3061 and declining slightly. But SPX has already closed above the +3σ Band, so this signal is a bit long in the tooth and has realized most of its gains.
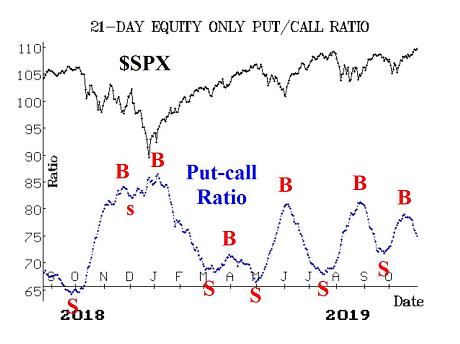
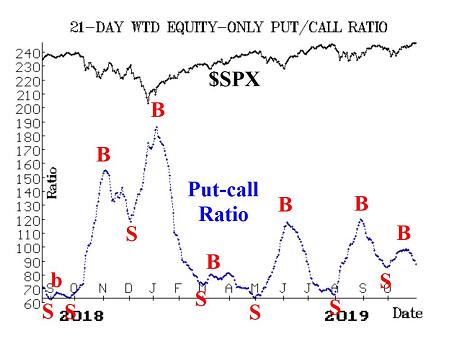
The equity-only put-call ratios remain on buy signals. Call volume has increased sharply as SPX has broken out to new all-time highs. Thus, these ratios are dropping and that is bullish for stocks. The weighted ratio is already nearly as low as it was in late September and appears to be headed lower.
Meanwhile, the latest Total put-call ratio buy signal is in place as well. The previous buy signal of Sept. 4 finally reached its target of a 100-point SPX gain when the index traded above 3037. This newest Total put-call ratio buy signal (of Oct. 23) has an upside S&P target of 3104.
Market breadth was been positive, although not overly so. For example, there hasn’t been anything even close to a “90% up day.” Regardless, both breadth oscillators remain on buy signals and are in modestly overbought territory. On a breakout to new highs by SPX, we’d like to see these breadth oscillators get extremely overbought, if possible. That hasn’t happened yet.
Cumulative breadth has been strong. Both the “stocks only” and the NYSE cumulative advance-decline lines are trading at new all-time highs. That has been the case for the last four consecutive trading days in “stocks only” terms and for 10 of the last 12 trading days in NYSE terms. Hence there is no negative divergence from this indicator. Note that’s all one can say about cumulative breadth. It is not a predictor of further market gains. That is, there is no positive convergence from cumulative breadth. Many bear markets have started with cumulative breadth at a new all-time high. Its best use is as a warning indicator — when breadth declines but the stock market continues on higher. That is not the case at this time.
New highs continue to outpace new lows across all three data sets — NYSE, Nasdaq and “stocks only.” So this indicator remains bullish and is not giving a negative divergence currently.
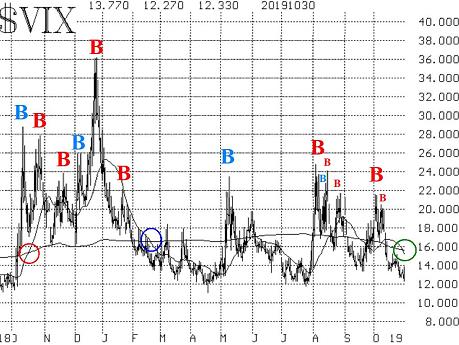
Volatility has decreased substantially, and that is positive for stocks as long as it continues. The VIX “spike peak” buy signal of Oct. 4 is nearing its “expiration date.” That is, the trading system that we built around the VIX “spike peak” buy signals calls for staying in the position for 22 trading days. In this case, the 22nd trading day is Nov. 5. So we would be looking to take profits or roll the position up to higher strikes at that time.
The intermediate-term trend of VIX VIX, +11.19% is downward, and that is bullish, too. There was a scare a few weeks ago that VIX might be breaking out to the upside, but that did not happen. Now, the 20-day Moving Average of VIX has crossed below the 200-day MA, and VIX is below the 200-day (green circle on the accompanying chart). That is a bullish status for stocks, and it will be that way as long as VIX remains below its 200-day moving average (which is currently at 15.70 and declining). So, for simplicity’s sake, let’s say that a VIX close above 16 would be a sign for caution. Lacking that, this is just another bullish indicator.
The construct of volatility derivatives is quite bullish, too, as the term structures are sloping upward and the VIX futures are trading at large premiums to VIX.
In summary, all of the indicators are bullish at this time, including — finally — the SPX chart itself. However, things can change quickly, especially if complacency sets in. So we would continue to roll profitable calls up to higher strikes along the way but maintain long positions until sell signals actually occur.
New recommendation: Tiffany
Tiffany & Co. TIF, -0.40% (TIF) received a surprise takeover bid of $120 from LVMH MC, +0.07% LVMUY, -0.27%. Analysts agree that the bid is too low. Tiffany stock initially traded up toward $130 after the bid was made public, although it has traded back down somewhat because 1) the company rejected the bid (expected), and 2) analysts have started to lower their estimates on what LMVH could ultimately pay. Still, there is a wide range of analyst estimates as to what the company is worth — from $130 to $180. Stock volume patterns are very strong and improving. LVMH says it does not want to do a hostile deal. We are going to bid for some slightly out-of-the-money calls. If bought, we will hold without a stop.
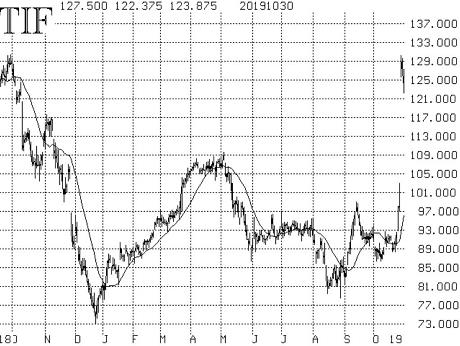
Buy 2 TIF Dec (20th) 125 calls
At a price of 5.00 or less.
TIF: 123.89Dec (20th) 125 call: 5.25 offered.
Follow-up action
All stops are mental closing stops unless otherwise noted.
• Long 2 AXTA Nov (15th) 30 calls: Hold without a stop while the company evaluates strategic alternatives. Supposedly the company has found one private-equity bidder.
• Long 4 SPY Nov (1st) 304 calls: These were bought in line with the Total put-call ratio buy signal of early September. That buy signal has now reached its target price of 3037 on SPX, so sell these calls now to close this position.
• Long 3 SPY Nov (15th) 300 calls and short 3 SPY Nov (15th) 306 calls: This position was bought in line with the “modified Bollinger Band” buy signal that occurred on Oct. 4. We rolled the spread up six points previously. Since SPX has closed above the +3σ Band, we want to adjust this position: Sell this spread and replace it by buying 3 SPY Nov (15) 304 calls.
• Long 3 SPY Nov (15th) 300 calls and short 3 SPY Nov (15th) 306 calls: This spread was bought in line with the VIX “spike peak” buy signal that occurred on Oct. 4. Stop yourself out if VIX closes above 21.46. Furthermore, if SPY trades at 306 at any time, close the spread, and go long 6 SPY Nov (15th) 306 calls. This trade “expires” (see the market commentary write-up earlier in this newsletter) on Nov. 5. So, if you haven’t rolled per the previous sentence, then roll to 6 SPY Nov (15th) at-the-money calls at the close of trading on Nov. 5.
• Long 8 NYCB Nov (15th) 12 calls: These were stopped out on Wednesday, when New York Community Bancorp. NYCB, -0.46% inexplicably fell sharply on an in-line earnings report.
• Long 2 ONCE Dec (20th) 105 calls: There are strong rumors that the FTC is going to approve this deal ($114.50 cash, by Roche ROG, +0.17% RHHBY, +0.32% ), The stock jumped higher, but remains below the ultimate price it should trade at if this is a “done deal.” So continue to hold without a stop while Roche tries to work out the takeover terms with the government.
• Long 4 HGV Nov (15th) 34 calls: Hold without a stop while this process works through.
• Long 4 SPY Dec (20th) 309 calls: These were bought in line with the latest Total put-call ratio buy signal, whose target is SPX 3104.
• Long 2 SPY Nov (8th) 301 calls: These calls were bought in line with the October Seasonal buy signal of Oct. 25. Sell these calls at the close of trading on Nov. 4. Furthermore, if SPY advances to 307, roll to the Nov (8th) 307 calls.
Send questions to: [email protected].
Lawrence G. McMillan is president of McMillan Analysis, a registered investment and commodity trading advisor. McMillan may hold positions in securities recommended in this report, both personally and in client accounts. He is an experienced trader and money manager and is the author of the best-selling book “Options as a Strategic Investment.”
Disclaimer: ©McMillan Analysis Corporation is registered with the SEC as an investment advisor and with the CFTC as a commodity trading advisor. The information in this newsletter has been carefully compiled from sources believed to be reliable, but accuracy and completeness are not guaranteed. The officers or directors of McMillan Analysis Corporation, or accounts managed by such persons may have positions in the securities recommended in the advisory.


