


After a spectacular run by the S&P 500 index and other major benchmarks, a small decline has begun. Is it a tradable correction? Only time will tell, of course, but our indicators have weakened somewhat, so there is a reasonable chance that it is. It is worth remembering, however, that the period from Thanksgiving through the beginning of the new year is usually a seasonally bullish one, so the time for a correction is relatively small.
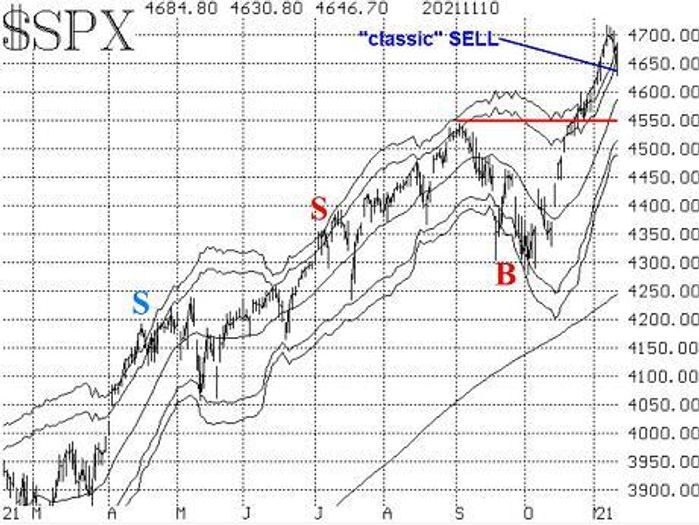
The S&P SPX, +0.72% had risen so fast since Oct. 13, and especially since breaking out to new all-time highs on Oct. 25, that there really isn’t much support near current levels. The most obvious “traditional” support would be at the old breakout level: 4525 – 4550 (horizontal red line on the accompanying chart).
The rapid rise in stock prices had moved SPX above the +4σ “modified Bollinger Band” (mBB), and it walked up the outside of that Band from Oct. 26 to Nov. 9, a period of 11 trading days – quite a long time to be outside of the +4σ Band. But now, it has fallen back and closed below the +3σ Band, which generates a “classic” mBB sell signal.
While these “classic” signals have a long and profitable track record, there have been a lot of false signals as well. Hence, we prefer that signal to be confirmed – and that confirmed signal is what we call a McMillan Volatility Band (MVB) sell signal. It will be confirmed if SPX closes below 4630.
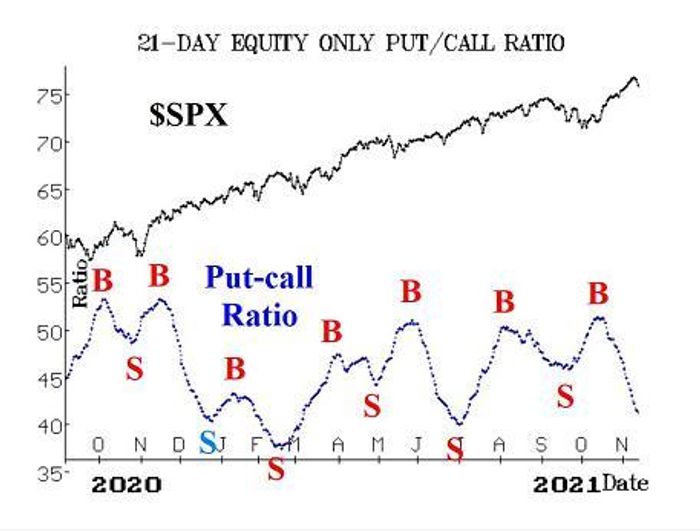
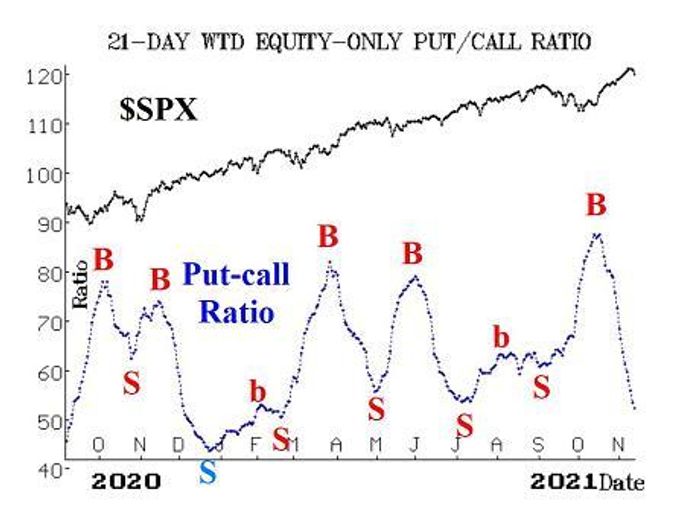
The equity-only put-call ratios remain strongly on buy signals that were issued about a month ago. As long as the ratios are declining, that is bullish for the overall stock market.
You can see from the accompanying charts that these ratios have now fallen far enough to be in line with the area from which previous sell signals were generated earlier this year. However, that only makes them “overbought.” They will only generate sell signals if they roll over and begin to rise. That does not appear to be imminent.
Market breadth has been one of the more interesting indicators. Our breadth oscillators had remained on buy signals since Sept. 22, except for one day in that rather lengthy time period. But now they have weakened, and breadth oscillator sell signals may be at hand. Technically, the action on Nov. 10 did generate a breadth sell signal, but we usually require at least a two-day confirmation of that signal before acting on it.
Meanwhile, the cumulative breadth indicators have all improved to new all-time highs. That includes the previously-lagging “stocks only” cumulative Advance-Decline line. The others are the NYSE cumulative A-D line, and cumulative volume breadth (CVB).
All three of these and SPX made simultaneous new all-time highs on Nov. 9. As we have said many times before, this is not predictive! The fact that these cumulative indicators are making new all-time highs does not mean that SPX will trade higher from here.
I realize that many technical analysts say the opposite, but if you look at the history, you will see that many severely bearish and/or bear markets started with these cumulative indicators having recently been at new all-time highs. No, all that they are useful for is to discover a negative divergence. There was a negative divergence in the “stocks only” cumulative A-D line since last June 11, but it has now apparently been erased with this recent new high.
Regardless, we are not going to let our guard down concerning the market, negative divergence or not.
New 52-week highs have continued to dominate new 52-week lows. In fact, the dominance was so great that it was considered to be an overbought condition. That is starting to fade now, but a sell signal has not been generated. If NYSE new lows number at least 100 issues and are greater in number than NYSE new highs, that would be a sell signal.
Volatility indicators are still positive, for the most part. The VIX “spike peak” buy signal of Oct. 1 successfully expired a week ago. VIX VIX, -7.76% has not returned to “spiking mode” (an increase of at least 3.00 points in three days or less, using closing prices). If it does, that would set up the next VIX “spike peak” buy signal later. Meanwhile, the VIX 20-day moving average remains well below its 200-day MA, so that is a general bullish sign for stocks too.
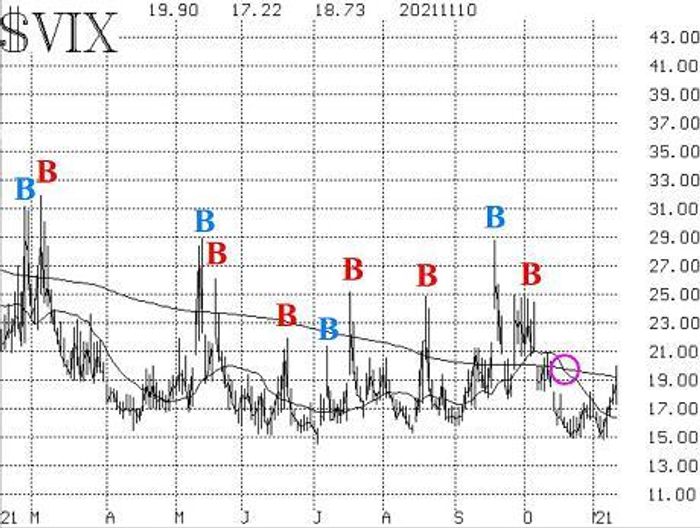
The construct of volatility derivatives remains pretty much in the same state it has been, and that is bullish for stocks. The VIX futures are trading at healthy premiums to VIX, and the term structure of the VIX futures slopes upward. Furthermore, the term structure of the CBOE Volatility Indices slopes upward, too.
In summary, there is some weakening beginning to take place, but as long as SPX remains above support at 4525, a “core” bullish position should be maintained. We will trade other confirmed signals around that position.
New conditional recommendation: MVB sell signal
A McMillan Volatility Band (MVB) sell signal is a re-confirmation of the “classic” modified Bollinger Band sell signal. The “classic” signal has occurred, so now we are merely looking for the confirmation, which will come on an SPX close below 4630.
IF SPX closes below 4630,
THEN buy 1 SPY Dec (3rd) at-the-money put
And sell 1 SPY Dec (3rd) put with a striking price 25 points lower.
If this MVB sell signal is confirmed, it would then be stopped out by a close above the +4σ Band. We will update that condition weekly.
New conditional recommendation: Breadth oscillator sell signal
Technically, our breadth oscillators have generated sell signals, but again we prefer at least a two-day confirmation of these signals, which have been know to experience whipsaws.
IF NYSE breadth (advances minus declines) is negative on Nov. 11,
THEN buy 1 SPY Dec (3rd) at-the-money put
And sell 1 SPY Dec (3rd) put with a striking price 25 points lower.
If this sell signal is confirmed, it will remain in effect until our breadth oscillators improve enough – either to generate a buy signal or to cancel out this sell signal. Since that requires daily recalculation, it is impossible to predict in advance. We will update the situation weekly in this report.
New conditional recommendation: NYSE new 52-week highs vs. low
As noted above, the number of new 52-week highs has been outnumbering 52-week lows quite easily. But that may be beginning to change. On Nov. 10, there were slightly more new lows on NASDAQ. We are concerned with NYSE data for this indicator, though.
IF NYSE new 52-week lows numbers at least 100 issues
And on the same day,
IF NYSE new 52-week lows outnumber NYSE new 52-week highs
THEN buy 1 SPY Dec (3rd) at-the-money put
And sell 1 SPY Dec (3rd) put with a striking price 25 points lower.
If this sell signal is confirmed, it would be stopped out later, if NYSE new highs outnumber NYSE new lows for two consecutive days.
New conditional recommendation: CMS Energy
This is a repeat from last week. The other conditional recommendation from last week – DraftKings DKNG, -0.49% – was not filled, and we are canceling that recommendation.
The put-call ratio buy signal in CMS Energy CMS, -0.13% is still in effect, but we want further confirmation by the price of the underlying stock:
Conditional Call buy in CMS:
IF CMS closes above 61.50,
THEN buy 2 CMS Dec (17th) 60 calls
CMS: 59.71
Follow-up action
All stops are mental closing stops unless otherwise noted.
Long 3 LDOS Nov (19th) 100 calls: These calls were bought and then rolled, in line with a weighted put-call ratio buy signal for Leidos LDOS, +1.19%. The put-call ratio has finally rolled over to a sell, so sell these calls if you can.
Long 3 PCAR Nov (19th) 85 calls: These calls were bought and then rolled, in line with a weighted put-call ratio buy signal for Paccar PCAR, -0.11%, which is still in effect. Continue to hold as long as the put-call ratio buy signal is in place. The “rolling” instruction remains the same: roll up to the Nov (19th) 92.5 calls, but only if PCAR trades at 92.5 at any time.
Long 4 EVH Nov (19th) 30 calls: The takeover talks are supposedly still going on here, but Evolent Health EVH, -0.77% is weakening. Continue to hold.
Long 2 ADP Nov (19th) 230 calls: The put-call ratio buy signal remains in effect here, and we rolled up when ADP ADP, +1.04% traded at 230. Roll up again if ADP trades at 237.5 at any time. Roll to the Nov (19th) 237.5 calls in that case.
Long 2 NKE Nov (19th) 175 calls: We rolled up when Nike NKE, +1.27% traded at 165 on Oct. 29 and rolled up again when it traded at 175 on Nov. 4. The put-call ratio has reached overbought extremes but has not yet rolled over to a sell signal, so continue to hold.
Long 4 CCJ Dec (17th) 26 calls: Raise the closing stop to 24.50.
Long 2 SPY Nov (19th) 456 calls: These were bought on the upside breakout to new highs (after reversing from a long put bear spread). Roll to 2 SPY Nov (26th) at-the-money calls. Raise the closing stop to 461, basis SPY.
Long 2 CONE Nov (19th) 80 calls: Hold without a stop, while these takeover rumors are circulating.
Long 2 SPY November (26th) 457 calls: This is our “core” long position. Roll to 2 SPY Nov (26th) at-the-money calls. Raise the closing stop to 461, basis SPY.
Long 2 AUPH Nov (19th) 30 calls: We are holding without a stop while the takeover rumors play out.
Send questions to: [email protected].
Lawrence G. McMillan is president of McMillan Analysis, a registered investment and commodity trading advisor. McMillan may hold positions in securities recommended in this report, both personally and in client accounts. He is an experienced trader and money manager and is the author of the bestselling book “Options as a Strategic Investment.”
Disclaimer:
©McMillan Analysis Corporation is registered with the SEC as an investment advisor and with the CFTC as a commodity trading advisor. The information in this newsletter has been carefully compiled from sources believed to be reliable, but accuracy and completeness are not guaranteed. The officers or directors of McMillan Analysis Corporation, or accounts managed by such persons may have positions in the securities recommended in the advisory.


