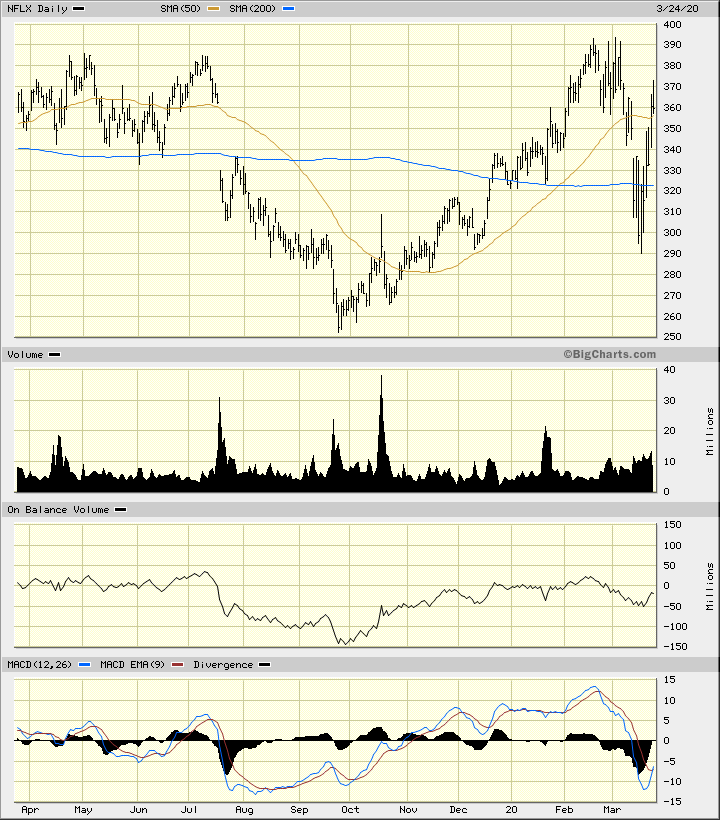
In this daily bar chart of NFLX, below, we can see that prices have rallied back above the 200-day moving average line and the 50-day moving average line. It is too soon for the slopes of these two indicators to turn positive, but that will be a positive development when it happens. The daily On-Balance-Volume (OBV) declined from the middle of February to the middle of March and now it is firming again. Read More...

Netflix Shares Poised to ‘Stream’ Ahead
In this daily bar chart of NFLX, below, we can see that prices have rallied back above the 200-day moving average line and the 50-day moving average line. It is too soon for the slopes of these two indicators to turn positive, but that will be a positive development when it happens. The daily On-Balance-Volume (OBV) declined from the middle of February to the middle of March and now it is firming again.


