


Today we’ll do a simple run through of a valuation method used to estimate the attractiveness of PayPal Holdings, Inc. (NASDAQ:PYPL) as an investment opportunity by taking the expected future cash flows and discounting them to their present value. We will use the Discounted Cash Flow (DCF) model on this occasion. Before you think you won’t be able to understand it, just read on! It’s actually much less complex than you’d imagine.
Companies can be valued in a lot of ways, so we would point out that a DCF is not perfect for every situation. If you still have some burning questions about this type of valuation, take a look at the Simply Wall St analysis model.
See our latest analysis for PayPal Holdings
The calculation
We are going to use a two-stage DCF model, which, as the name states, takes into account two stages of growth. The first stage is generally a higher growth period which levels off heading towards the terminal value, captured in the second ‘steady growth’ period. To begin with, we have to get estimates of the next ten years of cash flows. Where possible we use analyst estimates, but when these aren’t available we extrapolate the previous free cash flow (FCF) from the last estimate or reported value. We assume companies with shrinking free cash flow will slow their rate of shrinkage, and that companies with growing free cash flow will see their growth rate slow, over this period. We do this to reflect that growth tends to slow more in the early years than it does in later years.
Generally we assume that a dollar today is more valuable than a dollar in the future, so we discount the value of these future cash flows to their estimated value in today’s dollars:
10-year free cash flow (FCF) estimate
|
2023 |
2024 |
2025 |
2026 |
2027 |
2028 |
2029 |
2030 |
2031 |
2032 |
|
|
Levered FCF ($, Millions) |
US$7.28b |
US$8.52b |
US$8.68b |
US$8.38b |
US$8.24b |
US$8.18b |
US$8.20b |
US$8.25b |
US$8.34b |
US$8.45b |
|
Growth Rate Estimate Source |
Analyst x13 |
Analyst x9 |
Analyst x3 |
Analyst x2 |
Est @ -1.71% |
Est @ -0.62% |
Est @ 0.15% |
Est @ 0.69% |
Est @ 1.06% |
Est @ 1.33% |
|
Present Value ($, Millions) Discounted @ 6.4% |
US$6.8k |
US$7.5k |
US$7.2k |
US$6.5k |
US$6.0k |
US$5.6k |
US$5.3k |
US$5.0k |
US$4.8k |
US$4.6k |
(“Est” = FCF growth rate estimated by Simply Wall St)
Present Value of 10-year Cash Flow (PVCF) = US$59b
After calculating the present value of future cash flows in the initial 10-year period, we need to calculate the Terminal Value, which accounts for all future cash flows beyond the first stage. For a number of reasons a very conservative growth rate is used that cannot exceed that of a country’s GDP growth. In this case we have used the 5-year average of the 10-year government bond yield (1.9%) to estimate future growth. In the same way as with the 10-year ‘growth’ period, we discount future cash flows to today’s value, using a cost of equity of 6.4%.
Terminal Value (TV)= FCF2032 × (1 + g) ÷ (r – g) = US$8.5b× (1 + 1.9%) ÷ (6.4%– 1.9%) = US$194b
Present Value of Terminal Value (PVTV)= TV / (1 + r)10= US$194b÷ ( 1 + 6.4%)10= US$104b
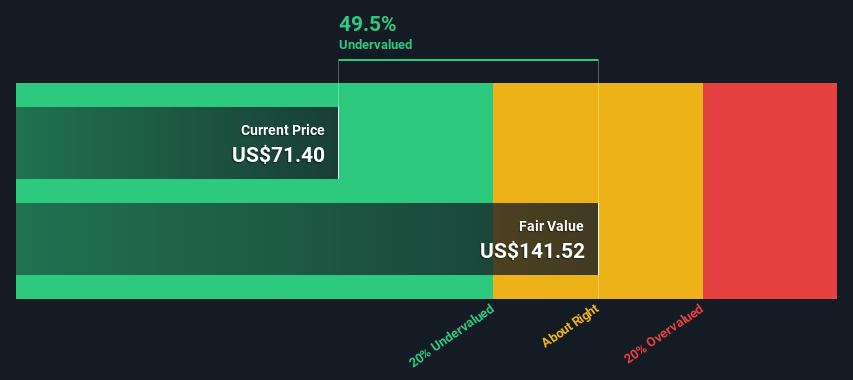
The total value is the sum of cash flows for the next ten years plus the discounted terminal value, which results in the Total Equity Value, which in this case is US$164b. In the final step we divide the equity value by the number of shares outstanding. Compared to the current share price of US$71.4, the company appears quite good value at a 50% discount to where the stock price trades currently. Remember though, that this is just an approximate valuation, and like any complex formula – garbage in, garbage out.

Important assumptions
We would point out that the most important inputs to a discounted cash flow are the discount rate and of course the actual cash flows. If you don’t agree with these result, have a go at the calculation yourself and play with the assumptions. The DCF also does not consider the possible cyclicality of an industry, or a company’s future capital requirements, so it does not give a full picture of a company’s potential performance. Given that we are looking at PayPal Holdings as potential shareholders, the cost of equity is used as the discount rate, rather than the cost of capital (or weighted average cost of capital, WACC) which accounts for debt. In this calculation we’ve used 6.4%, which is based on a levered beta of 1.048. Beta is a measure of a stock’s volatility, compared to the market as a whole. We get our beta from the industry average beta of globally comparable companies, with an imposed limit between 0.8 and 2.0, which is a reasonable range for a stable business.
Looking Ahead:
Valuation is only one side of the coin in terms of building your investment thesis, and it ideally won’t be the sole piece of analysis you scrutinize for a company. The DCF model is not a perfect stock valuation tool. Rather it should be seen as a guide to “what assumptions need to be true for this stock to be under/overvalued?” For example, changes in the company’s cost of equity or the risk free rate can significantly impact the valuation. Can we work out why the company is trading at a discount to intrinsic value? For PayPal Holdings, we’ve compiled three essential factors you should assess:
-
Risks: You should be aware of the 2 warning signs for PayPal Holdings we’ve uncovered before considering an investment in the company.
-
Management:Have insiders been ramping up their shares to take advantage of the market’s sentiment for PYPL’s future outlook? Check out our management and board analysis with insights on CEO compensation and governance factors.
-
Other Solid Businesses: Low debt, high returns on equity and good past performance are fundamental to a strong business. Why not explore our interactive list of stocks with solid business fundamentals to see if there are other companies you may not have considered!
PS. Simply Wall St updates its DCF calculation for every American stock every day, so if you want to find the intrinsic value of any other stock just search here.
Have feedback on this article? Concerned about the content? Get in touch with us directly. Alternatively, email editorial-team (at) simplywallst.com.
This article by Simply Wall St is general in nature. We provide commentary based on historical data and analyst forecasts only using an unbiased methodology and our articles are not intended to be financial advice. It does not constitute a recommendation to buy or sell any stock, and does not take account of your objectives, or your financial situation. We aim to bring you long-term focused analysis driven by fundamental data. Note that our analysis may not factor in the latest price-sensitive company announcements or qualitative material. Simply Wall St has no position in any stocks mentioned.


