


In this article we are going to estimate the intrinsic value of PayPal Holdings, Inc. (NASDAQ:PYPL) by taking the forecast future cash flows of the company and discounting them back to today’s value. Our analysis will employ the Discounted Cash Flow (DCF) model. Believe it or not, it’s not too difficult to follow, as you’ll see from our example!
Remember though, that there are many ways to estimate a company’s value, and a DCF is just one method. For those who are keen learners of equity analysis, the Simply Wall St analysis model here may be something of interest to you.
Check out our latest analysis for PayPal Holdings
Is PayPal Holdings Fairly Valued?
We use what is known as a 2-stage model, which simply means we have two different periods of growth rates for the company’s cash flows. Generally the first stage is higher growth, and the second stage is a lower growth phase. To start off with, we need to estimate the next ten years of cash flows. Where possible we use analyst estimates, but when these aren’t available we extrapolate the previous free cash flow (FCF) from the last estimate or reported value. We assume companies with shrinking free cash flow will slow their rate of shrinkage, and that companies with growing free cash flow will see their growth rate slow, over this period. We do this to reflect that growth tends to slow more in the early years than it does in later years.
Generally we assume that a dollar today is more valuable than a dollar in the future, so we discount the value of these future cash flows to their estimated value in today’s dollars:
10-year free cash flow (FCF) estimate
|
2023 |
2024 |
2025 |
2026 |
2027 |
2028 |
2029 |
2030 |
2031 |
2032 |
|
|
Levered FCF ($, Millions) |
US$6.94b |
US$8.03b |
US$8.99b |
US$8.38b |
US$8.05b |
US$7.88b |
US$7.81b |
US$7.80b |
US$7.85b |
US$7.92b |
|
Growth Rate Estimate Source |
Analyst x11 |
Analyst x10 |
Analyst x3 |
Analyst x2 |
Est @ -3.92% |
Est @ -2.15% |
Est @ -0.91% |
Est @ -0.04% |
Est @ 0.56% |
Est @ 0.99% |
|
Present Value ($, Millions) Discounted @ 6.9% |
US$6.5k |
US$7.0k |
US$7.4k |
US$6.4k |
US$5.8k |
US$5.3k |
US$4.9k |
US$4.6k |
US$4.3k |
US$4.1k |
(“Est” = FCF growth rate estimated by Simply Wall St)
Present Value of 10-year Cash Flow (PVCF) = US$56b
After calculating the present value of future cash flows in the initial 10-year period, we need to calculate the Terminal Value, which accounts for all future cash flows beyond the first stage. The Gordon Growth formula is used to calculate Terminal Value at a future annual growth rate equal to the 5-year average of the 10-year government bond yield of 2.0%. We discount the terminal cash flows to today’s value at a cost of equity of 6.9%.
Terminal Value (TV)= FCF2032 × (1 + g) ÷ (r – g) = US$7.9b× (1 + 2.0%) ÷ (6.9%– 2.0%) = US$164b
Present Value of Terminal Value (PVTV)= TV / (1 + r)10= US$164b÷ ( 1 + 6.9%)10= US$84b
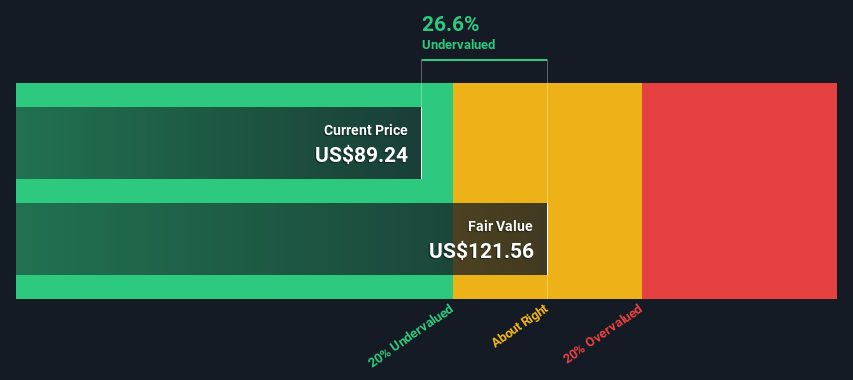
The total value is the sum of cash flows for the next ten years plus the discounted terminal value, which results in the Total Equity Value, which in this case is US$141b. The last step is to then divide the equity value by the number of shares outstanding. Compared to the current share price of US$89.2, the company appears a touch undervalued at a 27% discount to where the stock price trades currently. Valuations are imprecise instruments though, rather like a telescope – move a few degrees and end up in a different galaxy. Do keep this in mind.

The Assumptions
Now the most important inputs to a discounted cash flow are the discount rate, and of course, the actual cash flows. You don’t have to agree with these inputs, I recommend redoing the calculations yourself and playing with them. The DCF also does not consider the possible cyclicality of an industry, or a company’s future capital requirements, so it does not give a full picture of a company’s potential performance. Given that we are looking at PayPal Holdings as potential shareholders, the cost of equity is used as the discount rate, rather than the cost of capital (or weighted average cost of capital, WACC) which accounts for debt. In this calculation we’ve used 6.9%, which is based on a levered beta of 1.050. Beta is a measure of a stock’s volatility, compared to the market as a whole. We get our beta from the industry average beta of globally comparable companies, with an imposed limit between 0.8 and 2.0, which is a reasonable range for a stable business.
Looking Ahead:
Whilst important, the DCF calculation shouldn’t be the only metric you look at when researching a company. The DCF model is not a perfect stock valuation tool. Rather it should be seen as a guide to “what assumptions need to be true for this stock to be under/overvalued?” For example, changes in the company’s cost of equity or the risk free rate can significantly impact the valuation. What is the reason for the share price sitting below the intrinsic value? For PayPal Holdings, we’ve put together three pertinent elements you should assess:
-
Risks: Be aware that PayPal Holdings is showing 3 warning signs in our investment analysis , you should know about…
-
Management:Have insiders been ramping up their shares to take advantage of the market’s sentiment for PYPL’s future outlook? Check out our management and board analysis with insights on CEO compensation and governance factors.
-
Other Solid Businesses: Low debt, high returns on equity and good past performance are fundamental to a strong business. Why not explore our interactive list of stocks with solid business fundamentals to see if there are other companies you may not have considered!
PS. The Simply Wall St app conducts a discounted cash flow valuation for every stock on the NASDAQGS every day. If you want to find the calculation for other stocks just search here.
Have feedback on this article? Concerned about the content? Get in touch with us directly. Alternatively, email editorial-team (at) simplywallst.com.
This article by Simply Wall St is general in nature. We provide commentary based on historical data and analyst forecasts only using an unbiased methodology and our articles are not intended to be financial advice. It does not constitute a recommendation to buy or sell any stock, and does not take account of your objectives, or your financial situation. We aim to bring you long-term focused analysis driven by fundamental data. Note that our analysis may not factor in the latest price-sensitive company announcements or qualitative material. Simply Wall St has no position in any stocks mentioned.
Join A Paid User Research Session
You’ll receive a US$30 Amazon Gift card for 1 hour of your time while helping us build better investing tools for the individual investors like yourself. Sign up here


