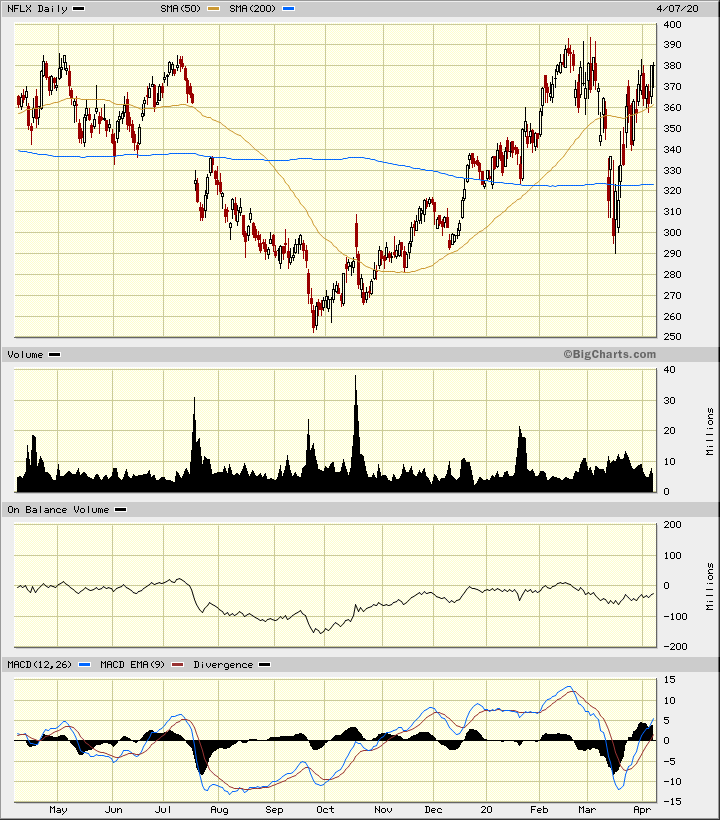
Netflix Inc. is oh so close to an important upside breakout. In the daily Japanese candlestick chart of NFLX, below, we can see how the stock declined with the broader market from February into the middle of March. Prices have rebounded swiftly climbing above the 50-day and 200-day moving averages and pushing through most of the chart resistance in the $360-$390 area. Read More...

Ready, Set, Go: Netflix Is Poised for a Key Upside Breakout
Netflix Inc. is oh so close to an important upside breakout. In the daily Japanese candlestick chart of NFLX, below, we can see how the stock declined with the broader market from February into the middle of March. Prices have rebounded swiftly climbing above the 50-day and 200-day moving averages and pushing through most of the chart resistance in the $360-$390 area.


