


First published on Simply Wall St News
A top-down approach comes from looking at market indicators and discovering potential companies by comparing their fundamentals with those of peers. In our analysis, we arrived at Alphabet Inc. ( NASDAQ:GOOGL ) as a stable stock. We outline the conclusions and describe our process below.
Here are the key takeaways of our analysis:
-
The Communications industry is a gaining traction, and seems to be slightly undervalued.
-
Among the peers, we singled-out Alphabet as a stable and growing stock.
-
The company has attractive fundamentals, and it seems that both the market and analysts expect it to grow in the future.
Market Performance
We start by looking at the market indicators, and notice, that in the last 7 days, the U.S. Communications industry has been leading by 2.38% , outperforming other industries.
The price increase seems to be influenced by the steady recovery of Meta ( NASDAQ:FB ) – Which has silently gained some 4.6%.
The 3-year average P/E for the Communications industry is 21.5x while currently the median P/E is 20.1x. For investors that believe prices converge to the average, this means the industry has some 6.5% upside left.
The chart below, shows what is currently happening in the industry:
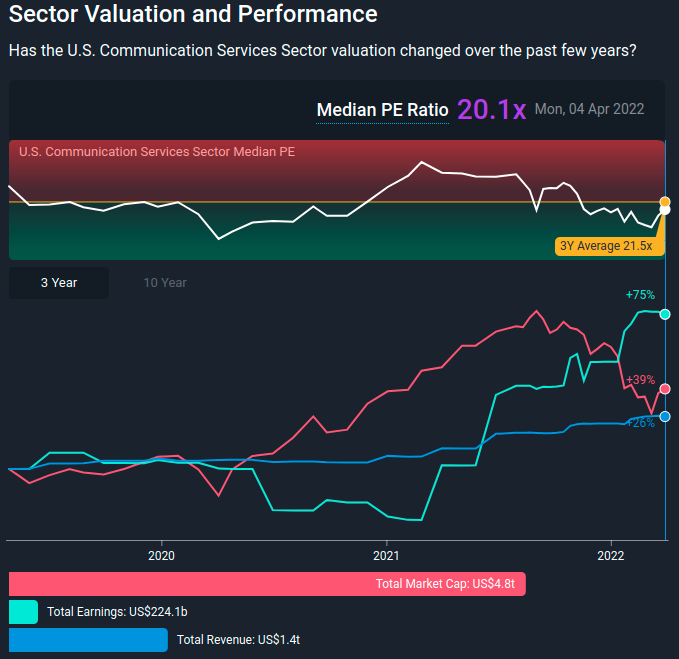
It is important to notice that the aggregate market cap for this industry has fallen down since its all-time high, while earnings have set records. We shouldn’t be too quick to judge that the “market” is undervalued, but rather ask: What could be causing the disconnect between earnings and market cap?
Markets are forward-looking – which means that the current price (market cap) reflects the expectations for future earnings . By this logic, investors and analysts are expecting to see a decline in the future earnings of Communications stocks.
Now, here is where we can find some opportunity – While some stocks will indeed make less, the ones that manage to retain or grow their earnings level may see their price further appreciate.
Therefore, what we need, is to find the companies that will at least slightly grow in the future. Or, pick a winner from the losers.
– – – – –
Love Details?
Ever wonder why you keep seeing P/E ratios of around 20x all over? What is magical about this number?
One way to approach this, is to look at it through the lens of valuation: If we take current earnings, assume inflation-level growth, we can arrive at the intrinsic value of the industry (or an index).
Calculation: Future Earnings / (Cost of Equity – Riskfree Rate) or
Future Earnings: 224.1 * 1.0255 = 229,815 (we get the 1.0255 from 1 + today’s U.S. 10 Year T Bond Yield )
Cost of Equity is the Current Enterprise Risk Premium + The Riskfree Rate (you can also adjust for Risk by using an Industry Beta , but the Communications industry is evolving so using its beta might not be appropriate)
Cost of Equity: 4.75% + 2.55% = 7.3%
Discount Rate or Required rate of Return: 7.3% – 2.55% = 4.75%
Now for the valuation: $229,815b ÷ 0,0475 = $4.838t. This is the value of the earnings in the Communications Industry (compare to the image above) .
Remember that magic 20x P/E? Take the Value and divide by Earnings: $4838 / $229.815 = 21x Done!
In essence, analysts are using a shortcut to assess the value of cash flows by using the P/E ratio . In this case, we can argue that the industry P/E is 4.3% lower (undervalued) compared to the Intrinsic P/E, or that analysts are expecting a decline in future earnings.
– – – – –
Peer Comparison
The next phase is to filter out performers from this industry and pick a company. We are looking for market gainers, because that indicates interest, which may be justified based on their future outlook.
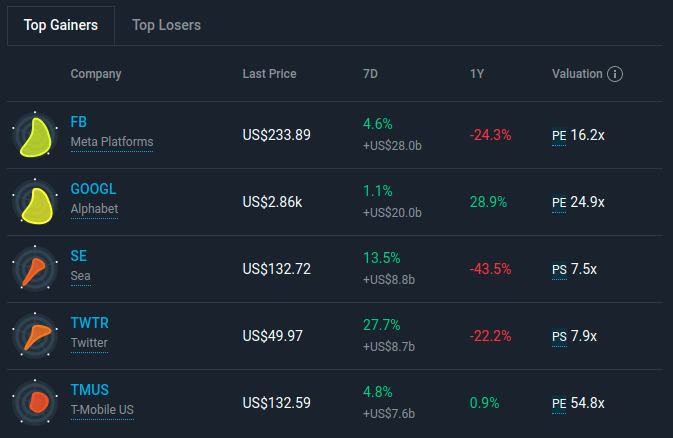
For the last 7 days, these are the top gainers:
Great, now let’s first go over the companies we didn’t select.
-
Twitter: TWTR – Jumped based on a change in ownership , but the company has a history of underperformance. We will avoid the “one offs”.
-
Sea: SE – Is a high growth stock, with most of its value in the future. No earnings yet and a bit risky.
-
T-Mobile US: TMUS – Negative free cash flow , and the high 54.8x P/E is due to low earnings. Possible future underperformer.
-
Meta : FB – Undervalued to the extent that investors panic sold, but may be a reflection of a drop in active users plus more expensive advertising. When we have a low P/E relative to the industry, we should ask ourselves, “if there are things that might damage the company in the future?”.
Google’s Financial Fundamentals
This leaves us with Alphabet Inc. ( NASDAQ:GOOGL )! We can be quite satisfied with this outcome, and here are a few reasons why.
Both short and long-term performance is high. The company has consistent earnings with a profit margin of 29.5%.
Forecast average annual earnings growth is 11.2%. However, for next year, analysts expect a flat 1.5% earnings growth . Considering that markets are forward-looking, it is highly likely that next year’s growth is priced in, but if you believe the projected average yearly growth, then we can expect the stock price to lead growth expectations.
Returns on capital (26.7%) are significantly higher than the costs of capital. Meaning, that every additional growth % creates value for investors, which should be reflected in the future stock price. About half of publicly listed companies fail this test , so make sure that the growth stocks you are watching have a higher return than their cost of capital (about 7.7% for U.S. companies).
Finally, we arrive at the P/E for Google.
The company has a P/E of 24.9x which is above the discussed industry’s median 21.5x P/E. To the extent we believe that the company will grow in the future, the difference between ratios can be explained as the expected future earnings growth . Or, that the market (as opposed to analysts) expects the company to grow earnings by 15.8% next year.
Based on current market pricing, a true annual earnings surprise for 2023 would be if Alphabet delivered more than US$88b.
Investing is likely best practiced on the long term, so it might be better to continue your analysis by considering our general valuation model for Alphabet Inc. , instead of focusing on next year.
Of course, you might find a fantastic investment by looking at a few other good candidates. So take a peek at this free list of companies with a strong growth track record, trading on a P/E below 20x.
Have feedback on this article? Concerned about the content? Get in touch with us directly. Alternatively, email [email protected]
Simply Wall St analyst Goran Damchevski and Simply Wall St have no position in any of the companies mentioned. This article is general in nature. We provide commentary based on historical data and analyst forecasts only using an unbiased methodology and our articles are not intended to be financial advice. It does not constitute a recommendation to buy or sell any stock and does not take account of your objectives, or your financial situation. We aim to bring you long-term focused analysis driven by fundamental data. Note that our analysis may not factor in the latest price-sensitive company announcements or qualitative material.