


Some of the stock market losses you’ve suffered this year have been in vain.
I know this will come as a big blow to those of you who invested in riskier stocks in the belief that you must incur that extra risk in order to have a chance at greater returns. Though bruised from your outsize losses, you at least were able to console yourself with the belief that you had no choice but to take those risks.
But you did have a choice; your losses were in large part avoidable. That’s because, contrary to the conventional wisdom, higher-risk stocks do not typically produce above-average returns.
That doesn’t help you much with the losses you’ve already incurred, of course, since they are water under the bridge. But a correct understanding of the historical relationship between risk and reward will enable you to prepare for the next bout of stock market volatility—whenever that may occur.
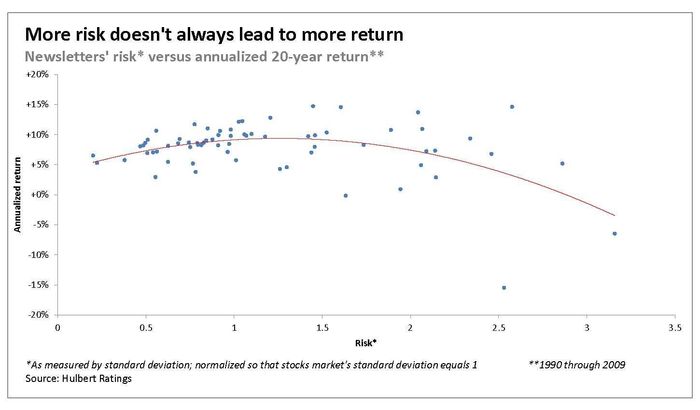
Take a look at the accompanying chart, which plots the riskiness and the annualized returns of each of the investment newsletter portfolios monitored by the Hulbert Financial Digest from 1990 through 2009. I chose to focus on this 20-year period because it includes two powerful bull markets (1990-1999 and 2002-2007) along with two major bear markets (2000-2002 and 2007-2009). If risk and reward were related in the way that conventional wisdom would have us believe, the trend line that best fits the data would be upwardly sloping.
It doesn’t. Notice that, but for newsletters at the conservative end of the spectrum, for which there is a slightly upwardly sloping trend line, that trend line slopes downward. (The trend line in the accompanying chart is a quadratic polynomial, drawn by Excel.)
You might object to this analysis on the grounds that it’s little more than Monday-morning quarterbacking on my part. But that’s not true. I have presented a similar chart and analysis on many past occasions, and in each of them I urged you to reduce risk then rather than wait until a bear market was under way.
Longer-term evidence
You also might wonder if my analysis was based on cherry-picked data. Would other periods of stock market history paint the same picture?
The answer most definitely is yes, according to just-released research from Guido Baltussen, Bart van Vliet and Pim van Vliet of Robeco Quantitative Investments in the Netherlands. (Baltussen also is a finance professor at Erasmus University Rotterdam.) For their study, entitled “150+ years of conservative investing: winning by losing less,” the researchers analyzed a unique database of U.S. stocks dating back to 1866. For each month since then, they sorted stocks into 10 equally-sized portfolios based on their trailing 36-month volatilities. The accompanying chart (reproduced from the Robeco website) summarizes what they found.
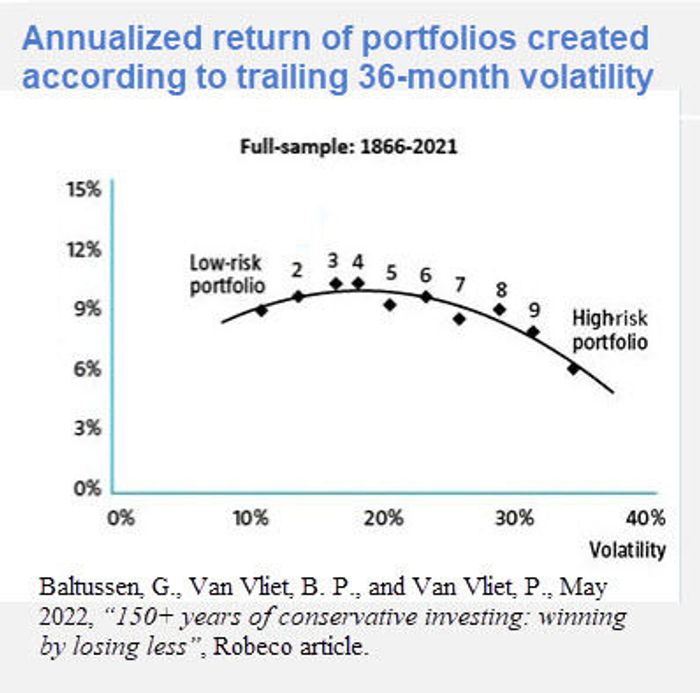
Notice the striking similarity in the shapes of the Robeco trend line and the one in the chart of investment newsletters. “In general,” the researchers observe, “this informs us that taking on more risk is not necessarily rewarded in the long run.”
The investment implication is clear: Other things being equal, you should favor lower-risk stocks. Over riskier ones. You will sleep more easily at night, and over time should make nearly as much money, or more, as the higher-risk stock portfolios that produce outstanding returns when the market is going their way and then lose the bulk of those gains when the market turns against them.
Making nearly as much money, while nevertheless sleeping more easily, is a winning combination. Unless you are a thrill seeker, this is a no-brainer.
Mark Hulbert is a regular contributor to MarketWatch. His Hulbert Ratings tracks investment newsletters that pay a flat fee to be audited. He can be reached at [email protected]


