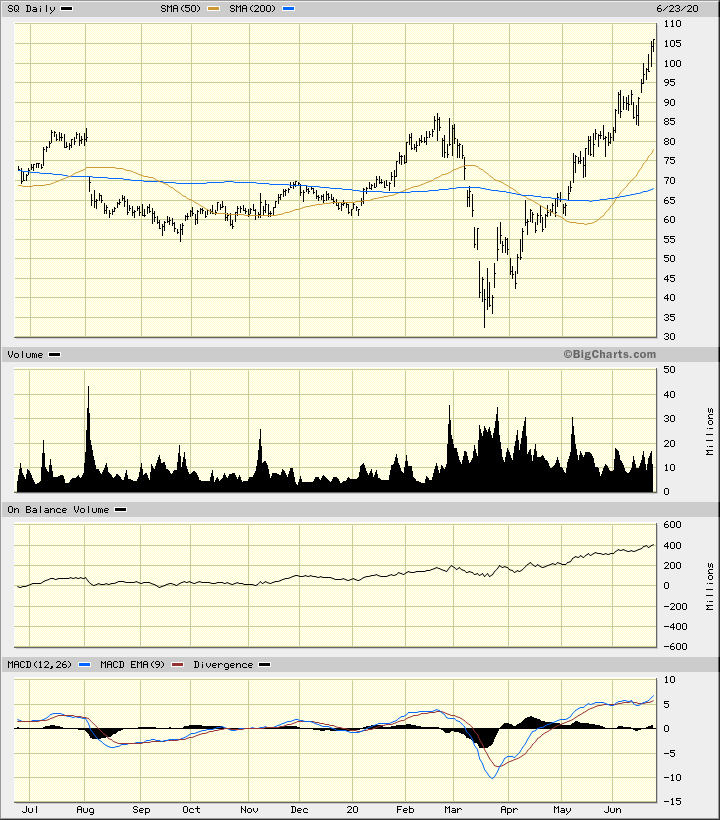
In the daily bar chart of SQ, below, we can see the steady uptrend from the March low. The On-Balance-Volume (OBV) line has been rising the past 12 months but the rally has been stronger since March. This strong OBV line tells us that buyers of SQ have been very aggressive and confirms the price gains. Read More...

Square Continues to Rally to New Heights: How to Play It Now
In the daily bar chart of SQ, below, we can see the steady uptrend from the March low. The On-Balance-Volume (OBV) line has been rising the past 12 months but the rally has been stronger since March. This strong OBV line tells us that buyers of SQ have been very aggressive and confirms the price gains.


