


Something important happened in the U.S. stock market this week, and whether you’re bullish or bearish, I suggest you watch closely.
Full disclosure: We’ve been approaching July from the sell side, and I’ve been transparent about this. In late June, we identified the sell zone; I reiterated it on CNBC July 5, talking about the broadening wedge pattern and discussion the 2,990-to-3,050 zone on the S&P 500 Index as key technical resistance. And throughout July I outlined technical problems with the rally on NorthmanTrader. Last week I talked about an imminent VIXplosion when the VIX VIX, -1.45% was at 12; today it hit almost 20 as of this writing.
That’s not to say I’m right or I told you so; it’s just a technical acknowledgment that the sell zone has proven to be worth a fade and the volatility pattern has kicked in.
But that’s not the important part.
The important part is what is happening with markets structurally from a technical perspective. Everybody needs to pay attention to this.
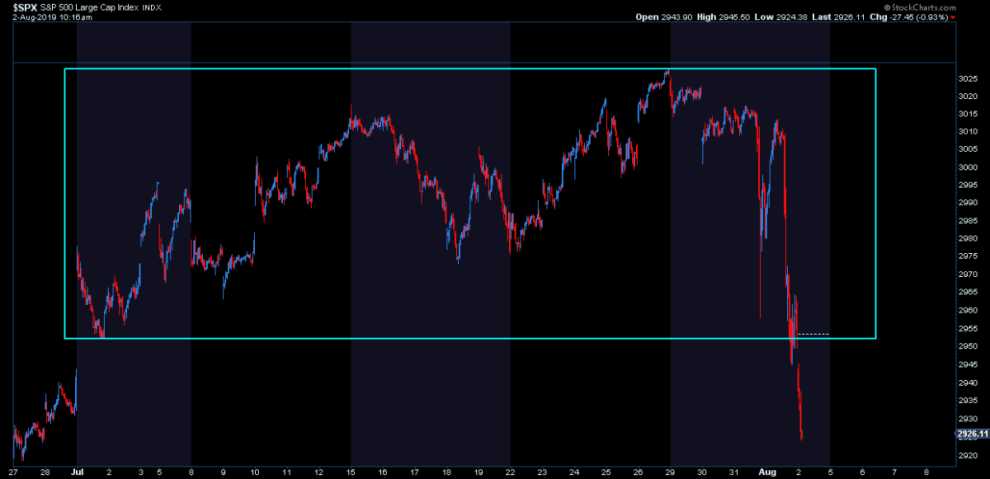
First, we made new highs in anticipation of easy money from the Federal Reserve. During all of July, investors kept pushing prices higher into the Fed meeting this week. The S&P 500 SPX, -0.73% reached 3,028, smack in the middle of the sell zone.
All of those buyers are currently underwater, with all of July’s prices taken out in only two days:
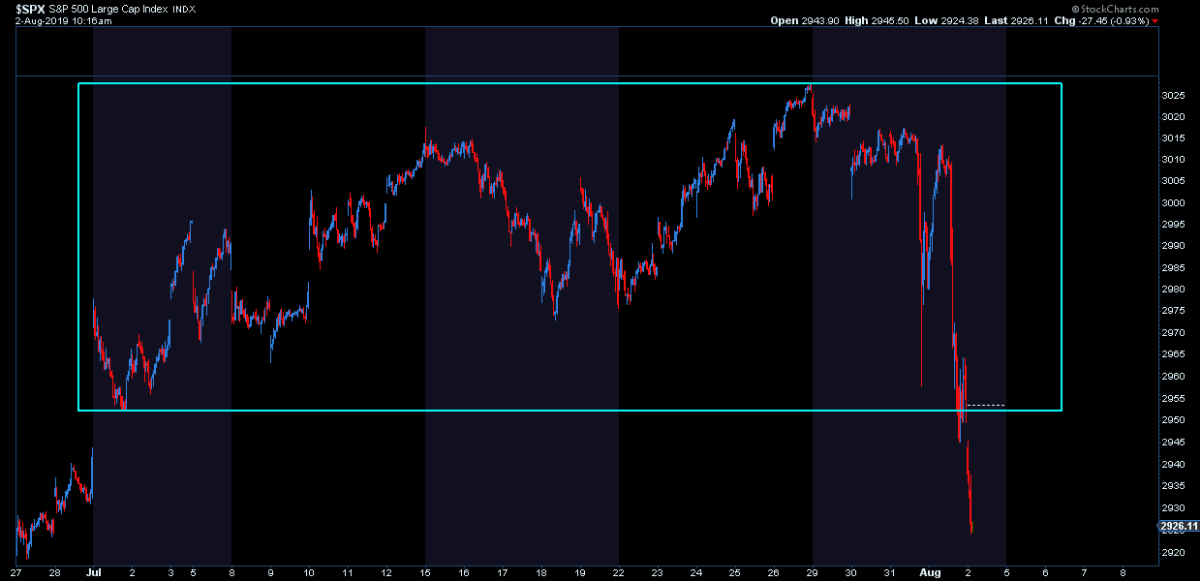
Why is this significant? Because of where it happened and what the result is.
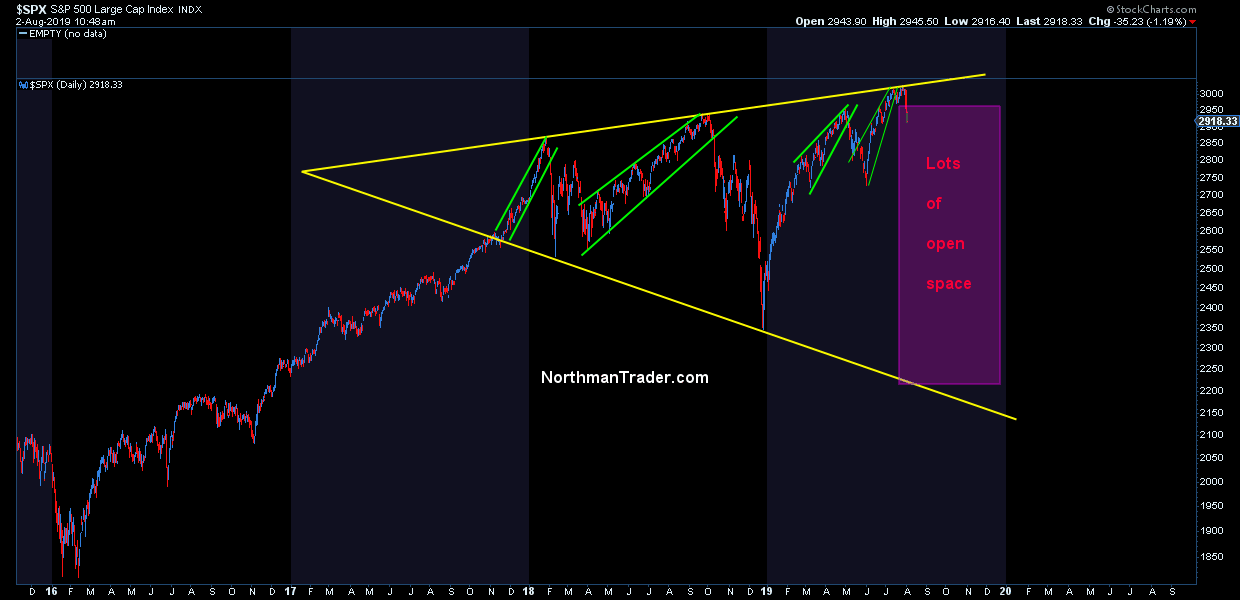
The where? Price perfectly tagged the broadening wedge we’ve been discussion and finally rejected from there:
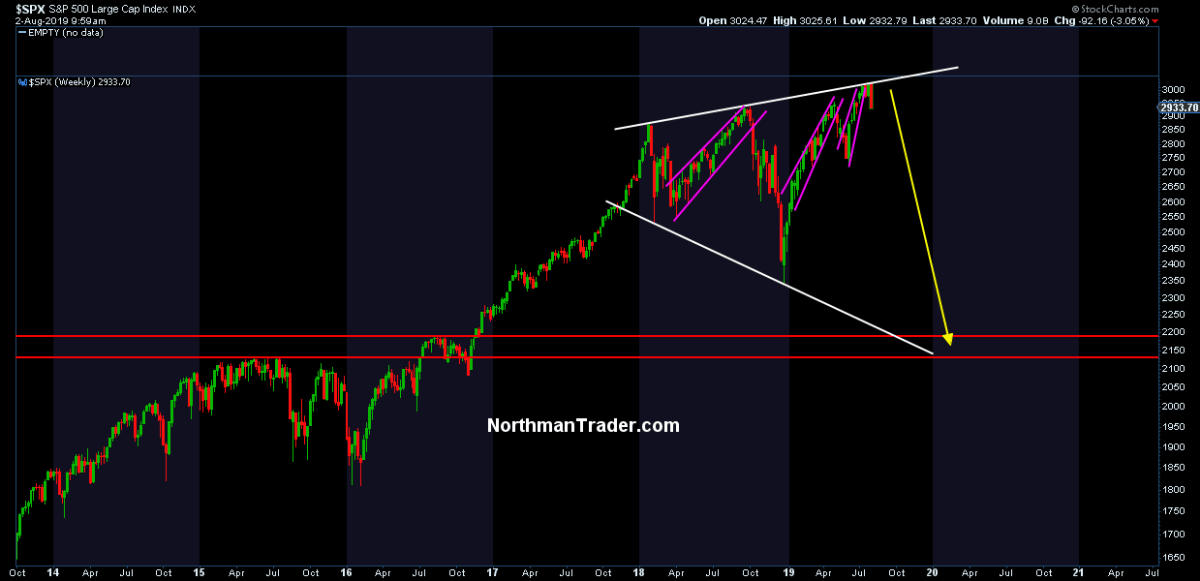
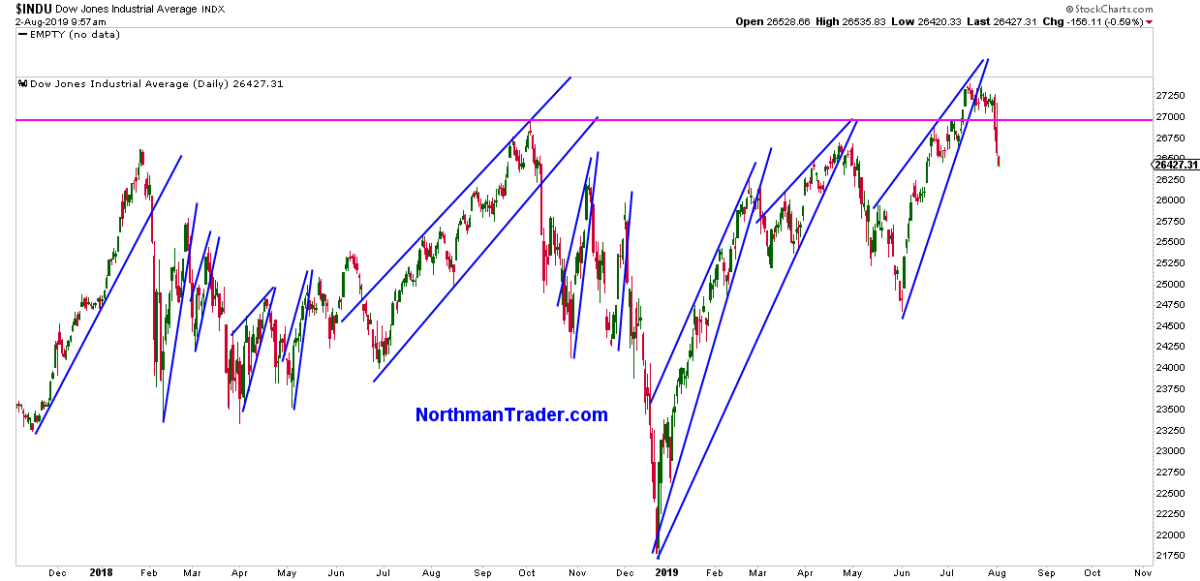
Now, this is no confirmation yet that the pattern target will hit, but it’s a warning sign, especially in this context: Key indices are losing their highs from last year.
Example Dow Jones Industrial Average DJIA, +0.00% :
Example Wilshire 5000 W5000FLT, -0.79% :
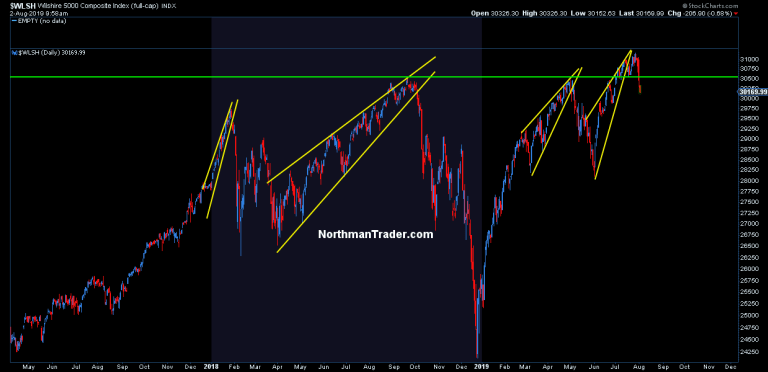
This places these index charts in imminent danger of having printed a fake breakout.
One of my technical criticisms of the rally and a favor in calling it a sell zone was internal weakness compared to previous highs.
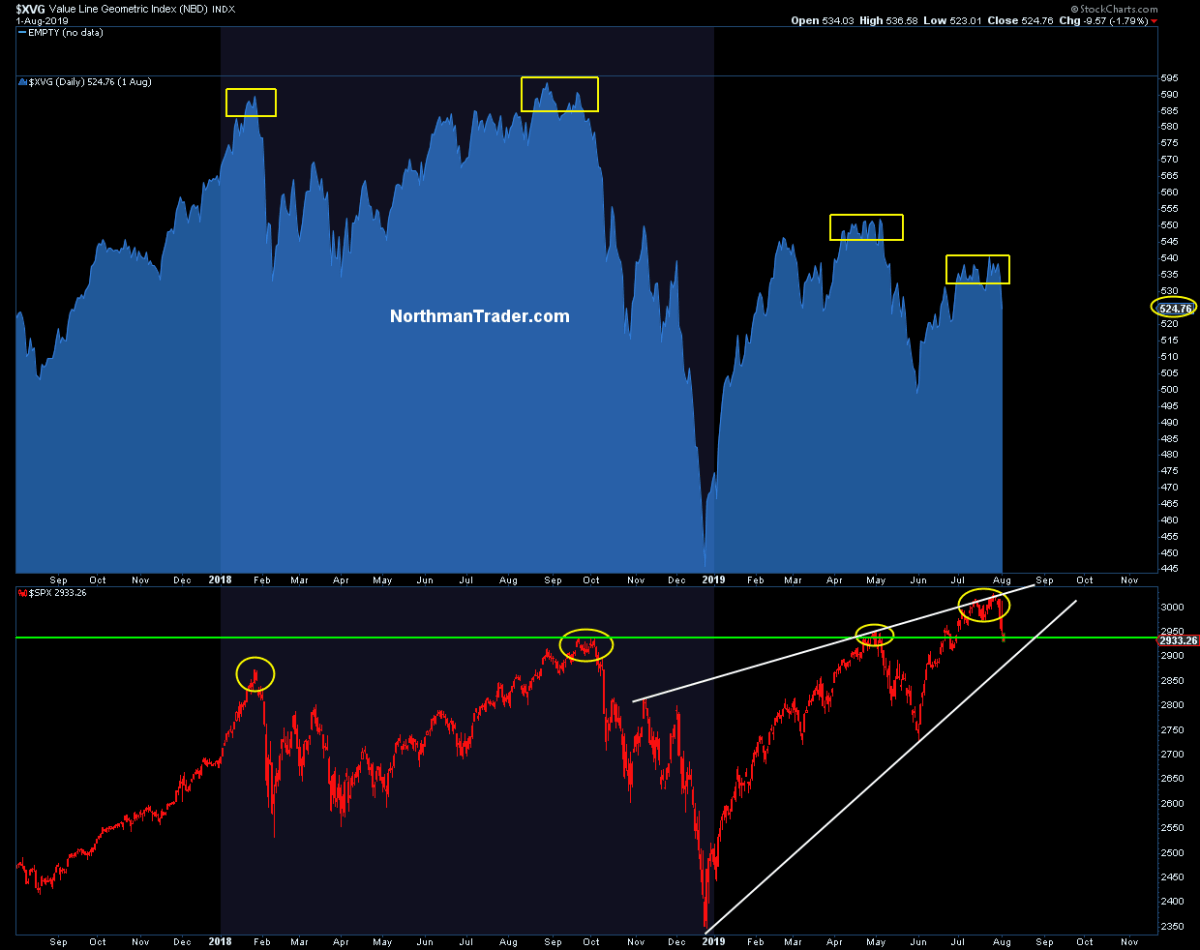
The value line geometric index has been making lower highs with each new rally and again in July:
Structurally I’ve been pointing to the VIX looking for another breakout; the breakout happened this week.
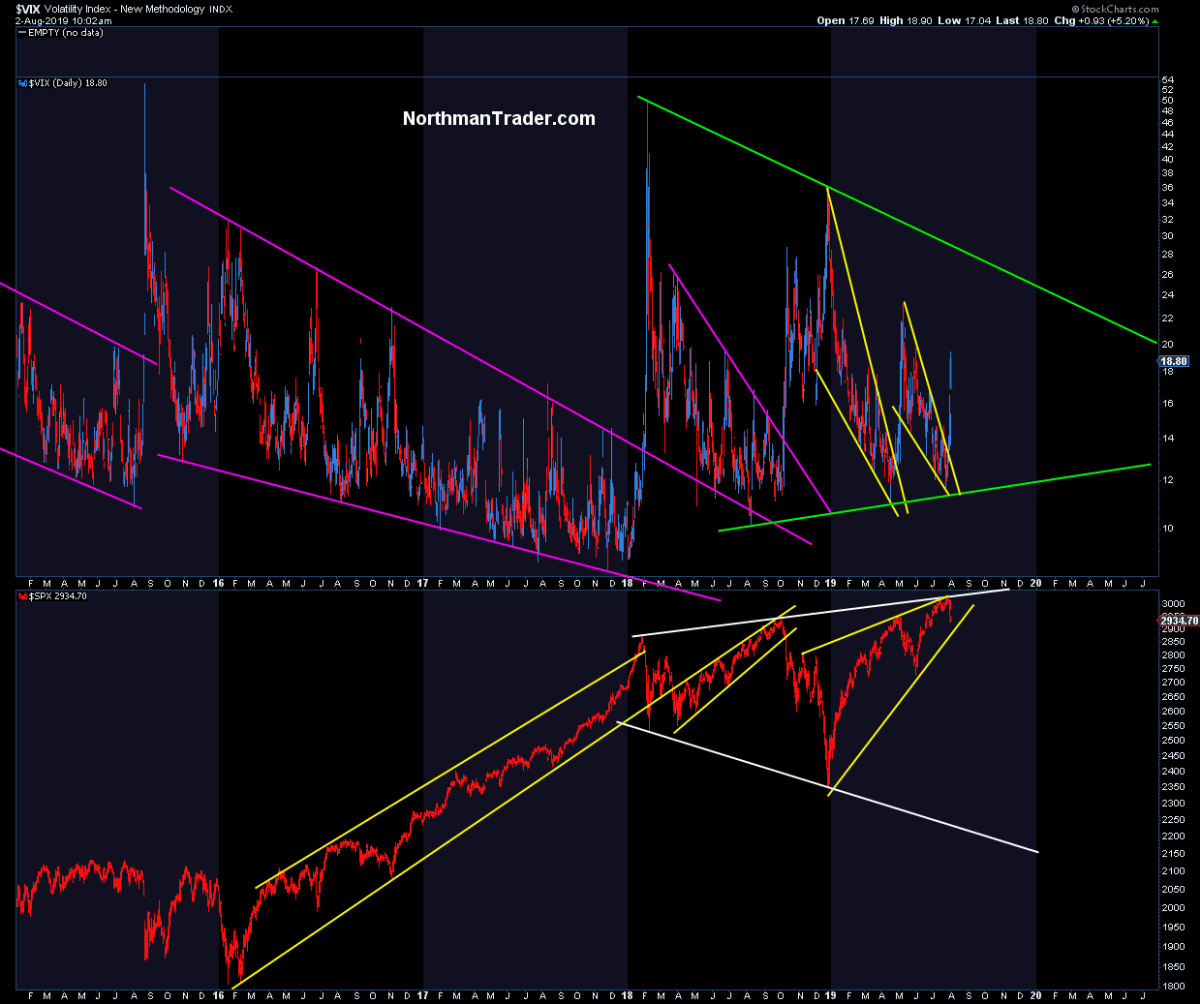
None of this precludes further rallies or confirms, as yet, the validity of the larger structural sell case.
However, what it does show is that the resistance zone outlined previously has been valid. As of this writing, the S&P 500’s low has been 2,914 (115 handles off the highs). Markets are now getting short-term oversold, but, as the previous highs from 2018 have now been broken to the downside, they represent a mission-critical task for bulls to recapture, especially in context of the larger megaphone pattern I’ve outlined.
Failure to recapture these highs risks that the larger technical pattern gets triggered. I outlined this the other day: There’s a lot of open space below:
Indeed, there is:
This is not about the day-to-day action. It’s about larger structural technical patterns, and they are telling a story that needs to be watched closely in the days ahead.
Read next: Here’s the real reason U.S. stocks are losing ground right now
Sven Henrich is founder and the lead market strategist of NorthmanTrader.com. He’s well-known for his technical, directional and macro analysis of global equity markets. Follow him on Twitter at @NorthmanTrader.


