


Editor’s Note: This is a free edition of The Technical Indicator, a daily MarketWatch subscriber newsletter. To get this column each market day, click here.
Technically speaking, the U.S. benchmarks’ grinding-higher recovery attempt remains in play, though amid increasingly uneven price action.
On a headline basis, the Nasdaq Composite has extended its break to positive year-to-date territory — reaching a 10-week high — while the S&P 500 and Dow industrials remain range-bound, but have tagged a month-to-date peak to start this week.
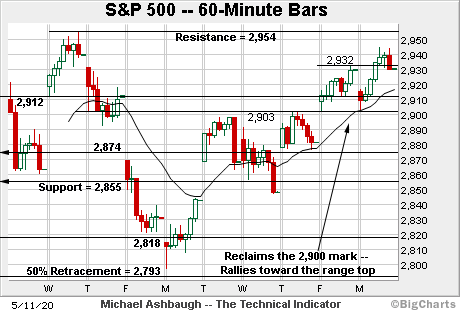
Before detailing the U.S. markets’ wider view, the S&P 500’s SPX, -0.12% hourly chart highlights the past two weeks.
As illustrated, the S&P has extended a break atop the 2,900 mark.
Tactically, recall that last week’s high (2,932) closely matched the 62% Fibonacci retracement of the 2020 crash (2,934).
On further strength, major resistance (2,954) matches the April peak.
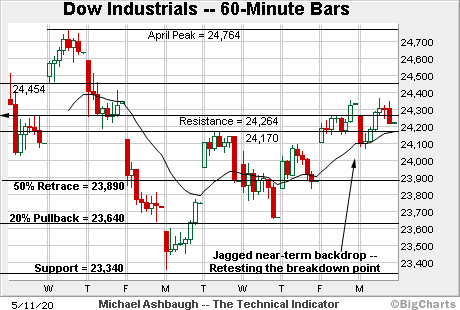
Meanwhile, the Dow industrials’ DJIA, +0.01% backdrop remains incrementally softer.
Still, the index continues to challenge its breakdown point (24,264). An extended retest remains underway this week.
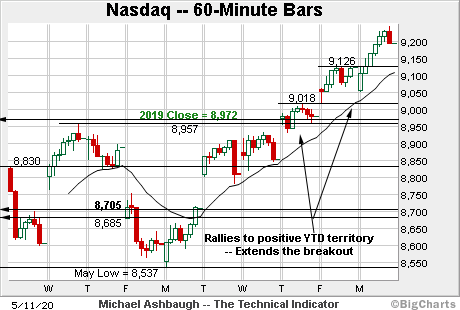
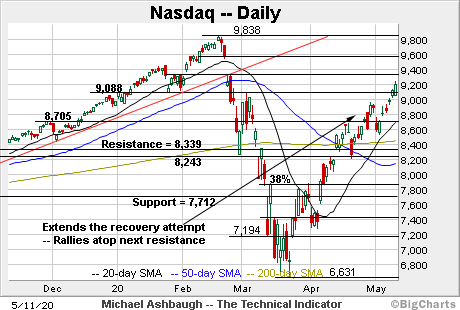
Against this backdrop, the Nasdaq Composite COMP, +0.35% remains the strongest benchmark.
As illustrated, the index has extended its May break to positive year-to-date territory. The prevailing upturn punctuates a bullish island reversal at the range bottom, a pattern defined by the gaps.
Tactically, a near-term floor (9,126) is followed by the 2019 close (8,972).
Widening the view to six months adds perspective.
On this wider view, the Nasdaq has reached 10-week highs, rising from an island reversal to start May.
The upturn builds on a similar April start, also punctuated by a bullish island reversal. (See for instance, the April 8 review.)
On further strength, resistance spans from 9,300 to 9,323, levels matching the bottom of the February gaps. The second February gap (9,323) punctuated the Nasdaq’s initial technical breakdown, as well as a bearish island reversal.
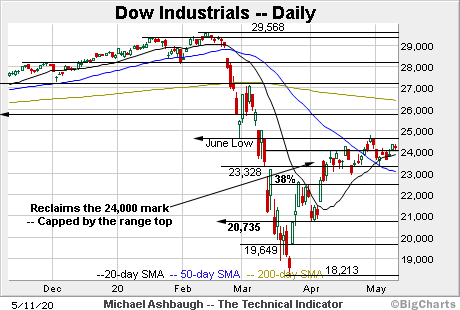
Looking elsewhere, the Dow Jones Industrial Average remains in consolidation mode.
Still, the index has extended its May upturn, reclaiming the 24,000 mark.
On further strength, major resistance matches the June 2019 low (24,680) and the February low (24,681).
Similarly, the S&P 500 has extended a rally from the May low.
The upturn places a second test of major resistance (2,954) firmly within view. (Resistance matches the May 2019 peak (2,954.1) the July 2019 peak (2,952.2) and the April 2020 peak (2,954.9).
The bigger picture
As detailed above, a notable divergence has surfaced to start May.
Namely, the Nasdaq Composite has extended its rally attempt — reaching positive year-to-date territory — while the S&P 500 and Dow industrials remain range-bound.
The net result is a broadly constructive start to the worst six months seasonally.
As it applies to the S&P 500, its intermediate-term bias remains bullish within the context of a bearish longer-term backdrop.
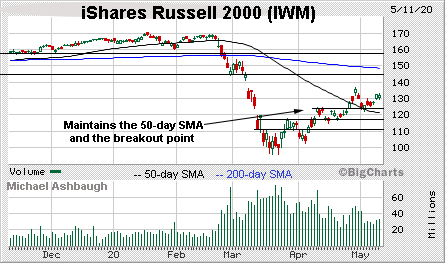
Moving to the small-caps, the iShares Russell 2000 ETF has sustained its recent breakout.
The May upturn punctuates a successful test of the breakout point and the 50-day moving average, currently 120.90.
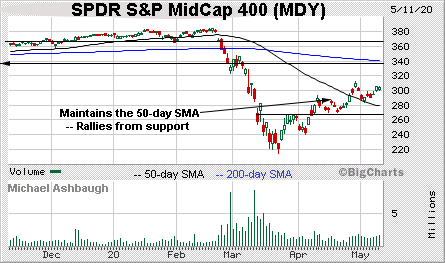
Similarly, the SPDR S&P MidCap 400 ETF has sustained its breakout, maintaining the 50-day moving average, currently 278.90.
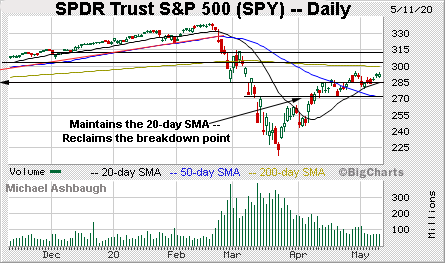
True to recent form, the SPDR Trust S&P 500 SPY, -0.07% remains incrementally stronger.
As illustrated, the SPY has maintained its 20-day moving average, currently 294.90, a level matching its former breakdown point (294.80).
On further strength, the April closing peak (293.21) and absolute April peak (294.88) remain within view.
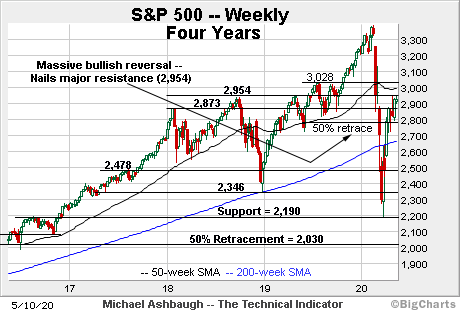
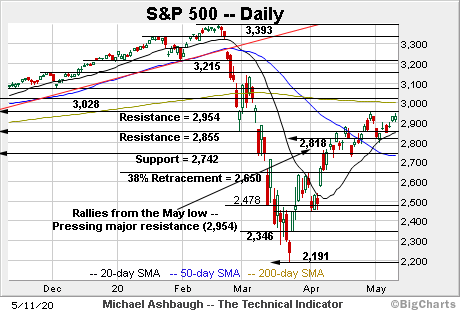
Moving to the four-year view, the S&P 500 has extended its rally from the March low.
Recall that last week’s close (2,929.8) marked the S&P’s best weekly close since early-March.
The upturn places major resistance (2,954) within view, a level closely matching the April peak (2,954.86).
Placing a finer point on the S&P 500, the index has reclaimed an inflection point roughly matching the 2,900 mark. Consecutive session lows (2,903) have registered nominally atop the round number.
Also recall that this two-week range has been underpinned by the S&P’s 50% retracement of the 2020 crash (2,793).
The May low (2,797) has registered nominally atop the retracement, a level also detailed on the four-year chart.
Returning to the six-month view, the S&P 500 has asserted a grinding-higher May upturn.
Tactically, major resistance (2,954) matches the April peak, and is followed by the marquee 200-day moving average, currently 3,001.
The pending retest of the April peak — an area that experienced selling pressure on the first test — will likely add color.
Conversely, the S&P 500’s intermediate-term bias remains bullish to the extent it maintains the 2,730-to-2,742 area, levels closely matching the 50-day moving average and major support. Recall that the late-April closing low (2,736) also matches/defines major support.
Also see: Charting a May whipsaw, S&P 500 holds key support to start worst six months seasonally.
Tuesday’s Watch List
The charts below detail names that are technically well positioned. These are radar screen names — sectors or stocks poised to move in the near term. For the original comments on the stocks below, see The Technical Indicator Library.
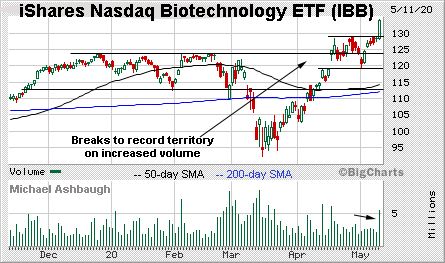
Drilling down further, the iShares Nasdaq Biotechnology ETF IBB, +1.53% — profiled April 21 — continues to outpace the broad market.
As illustrated, the group has knifed to all-time highs, amid a volume spike, clearing resistance matching the April peak. (The prevailing upturn punctuates a successful test of gap support at the May low, an area detailed previously.)
Though near-term extended, and due to consolidate, the breakout point (128.90) pivots to first support.
More broadly, the group remains well positioned on the five-year chart, rising from a multi-year base.
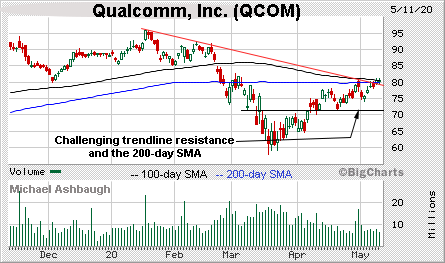
Moving to specific names, Qualcomm, Inc. QCOM, +0.87% is a large-cap name showing signs of life.
Technically, the shares are challenging trendline resistance closely matching the 100- and 200-day moving averages.
Underlying the upturn, Qualcomm’s relative strength index (not illustrated) has registered nearly four-month highs, improving the chances of an eventual breakout. A near-term target projects to the 86.50 area on follow-through.
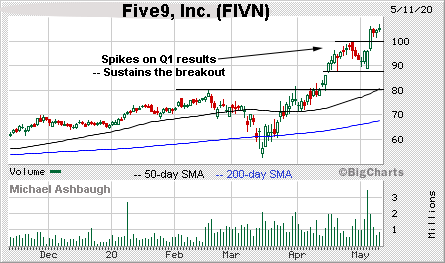
Initially profiled April 24, Five9, Inc. FIVN, +0.60% has added 8.1% and remains well positioned.
Earlier this month, the shares staged a strong-volume breakout, reaching record territory after the company’s first-quarter results.
The subsequent flag pattern has formed amid decreased volume, positioning the shares to build on the initial spike. Tactically, the breakout point pivots to support, circa 100, and a posture higher signals a firmly-bullish bias.
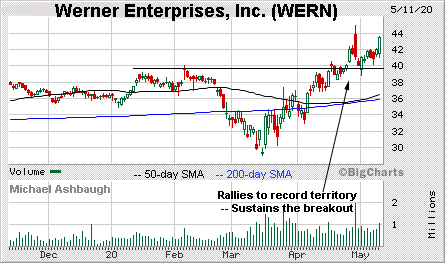
Werner Enterprises, Inc. WERN, -1.46% is a well positioned mid-cap trucking name.
Late last month, the shares briefly tagged record territory, rising amid a volume spike after the company’s quarterly results.
The subsequent pullback has been underpinned by the breakout point, an area matching major support also illustrated on the four-year chart. The prevailing rally attempt is intact barring a violation of the 39.50 area.
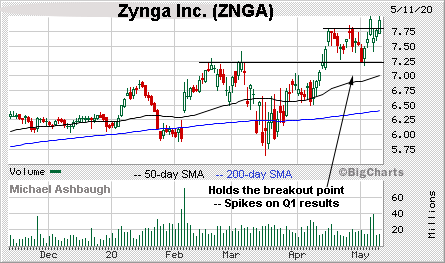
Finally, Zynga, Inc. ZNGA, +0.31% is a large-cap social game developer positioned to rise.
As illustrated, the shares have cleared the April range top, rising amid a volume spike after the company’s quarterly results.
The upturn originates from the breakout point (7.25), placing the shares at nearly eight-year highs, the best levels since May 2012. A near-term target projects to the 8.30 area on follow-through.
Editor’s Note: This is a free edition of The Technical Indicator, a daily MarketWatch subscriber newsletter. To get this column each market day, click here.
Still well positioned
The table below includes names recently profiled in The Technical Indicator that remain well positioned. For the original comments, see The Technical Indicator Library.
| Company | Symbol* (Click symbol for chart.) | Date Profiled |
| Jabil, Inc. | JBL | May 11 |
| Whirlpool Corp. | WHR | May 11 |
| Kinross Gold Corp. | KGC | May 11 |
| Avalara, Inc. | AVLR | May 8 |
| Packaging Corp. of America | PKG | May 8 |
| Salesforce.com, Inc. | CRM | May 8 |
| Facebook, Inc. | FB | May 7 |
| Catalent, Inc. | CTLT | May 7 |
| Spotify Technology S.A. | SPOT | May 5 |
| Paycom Software, Inc. | PAYC | May 5 |
| CrowdStrike Holdings, Inc. | CRWD | May 4 |
| iRobot Corp. | IRBT | May 4 |
| Steel Dynamics, Inc. | STLD | May 4 |
| F5 Networks, Inc. | FFIV | May 1 |
| Eli Lilly & Co. | LLY | May 1 |
| Cummins, Inc. | CMI | Apr. 30 |
| NetApp, Inc. | NTAP | Apr. 30 |
| AudioCodes, Ltd. | AUDC | Apr. 30 |
| Inphi Corp. | IPHI | Apr. 29 |
| Qorvo, Inc. | QRVO | Apr. 29 |
| Old Dominion Freight Line, Inc. | ODFL | Apr. 29 |
| Keysight Technologies, Inc. | KEYS | Apr. 28 |
| Dollar General Corp. | DG | Apr. 28 |
| AngloGold Ashanti Ltd. | AU | Apr. 28 |
| U.S. Steel Corp. | X | Apr. 28 |
| Cadence Design Systems, Inc. | CDNS | Apr. 27 |
| ServiceNow, Inc. | NOW | Apr. 27 |
| Snap, Inc. | SNAP | Apr. 27 |
| Centene Corp. | CNC | Apr. 27 |
| Abbott Laboratories | ABT | Apr. 24 |
| Five9, Inc. | FIVN | Apr. 24 |
| Chewy, Inc. | CHWY | Apr. 24 |
| Roku, Inc. | ROKU | Apr. 23 |
| Tesla, Inc. | TSLA | Apr. 23 |
| Shopify, Inc. | SHOP | Apr. 23 |
| iShares Nasdaq Biotechnology ETF | IBB | Apr. 21 |
| Teradyne, Inc. | TER | Apr. 20 |
| Electronic Arts, Inc. | EA | Apr. 20 |
| Verizon Communications, Inc. | VZ | Apr. 20 |
| VanEck Vectors Semiconductor ETF | SMH | Apr. 17 |
| Health Care Select Sector SPDR | XLV | Apr. 17 |
| Coupa Software, Inc. | COUP | Apr. 17 |
| Veeva Systems, Inc. | VEEV | Apr. 17 |
| American Tower Corp. | AMT | Apr. 17 |
| Okta, Inc. | OKTA | Apr. 16 |
| Target Corp. | TGT | Apr. 16 |
| Intel Corp. | INTC | Apr. 14 |
| Netflix, Inc. | NFLX | Apr. 14 |
| VanEck Vectors Gold Miners ETF | GDX | Apr. 14 |
| Invesco QQQ Trust | QQQ | Apr. 14 |
| SBA Communications Corp. | SBAC | Apr. 13 |
| Akamai Technologies, Inc. | AKAM | Apr. 13 |
| Citrix Systems, Inc. | CTXS | Apr. 6 |
| Ciena Corp. | CIEN | Apr. 6 |
| Seattle Genetics, Inc. | SGEN | Apr. 6 |
| DocuSign, Inc. | DOCU | Apr. 3 |
| Zscaler, Inc. | ZS | Apr. 3 |
| Moderna, Inc. | MRNA | Apr. 3 |
| RingCentral, Inc. | RNG | Mar. 30 |
| Activision Blizzard, Inc. | ATVI | Mar. 30 |
| Regeneron Pharmaceuticals, Inc. | REGN | Mar. 30 |
| Apple, Inc. | AAPL | Mar. 27 |
| Nvidia Corp. | NVDA | Mar. 27 |
| Dexcom, Inc. | DXCM | Mar. 27 |
| Amazon.com, Inc. | AMZN | Mar. 26 |
| Stamps.com, Inc. | STMP | Mar. 26 |
| Quidel Corp. | QDEL | Mar. 26 |
| Karyopharm Therapeutics, Inc. | KPTI | Mar. 20 |
| Domino’s Pizza, Inc. | DPZ | Mar. 20 |
| Walmart, Inc. | WMT | Mar. 19 |
| Kroger Co. | KR | Mar. 19 |
| Zoom Video Communications, Inc. | ZM | Mar. 19 |
| iShares MSCI Emerging Markets ETF** | EEM | Mar. 19 |
| eHealth, Inc. | EHTH | Jan. 31 |
| Newmont Corp. | NEM | Jan. 13 |
| Atlassian Corp. | TEAM | Jan. 7 |
| SPDR Gold Shares ETF | GLD | Jan. 2 |
| Advanced Micro Devices, Inc. | AMD | Nov. 7 |
| Teledoc Health, Inc. | TDOC | Nov. 1 |
| Costco Wholesale Corp. | COST | Mar. 6 |
| Microsoft Corp. | MSFT | Feb. 22 |
| * Click each symbol for current chart. | ||
| ** Not necessarily well positioned, though a recovery attempt is intact. |


