


The stock market’s run to all-time highs has the look of a classic grind higher, but bullish sentiment levels — a contrarian indicator — are getting extreme, technical analysts warned.
In a Thursday note with the title, “Stock Market: Sentiment Ludicrous, Risk Rising, But…”, Mark Arbeter of Arbeter Investments ran down a list of extreme sentiment readings, including:
- The 5-day Cboe equity-only put/call ratio has fallen to another record low of 0.37, eclipsing the previous record low from June (data goes back to late 2003). Puts are options that give the holder the right but not the obligation to sell the underlying asset at a set price by a certain date. Calls offer the same right to buy.
- The National Association of Active Investment Managers Exposure Index hit 107% two weeks ago, the second-highest reading since the survey began in 2006. The highest level of 109% was hit in December 2017, which was followed by a quick 12% correction in January 2018, Arbeter noted.
- A highly elevated Investors Intelligence survey reading and a Rydex bull/bear ratio that is at its highest since February.
Analysts at Bespoke Investment Group also flagged elevated sentiment levels, in a Thursday note.
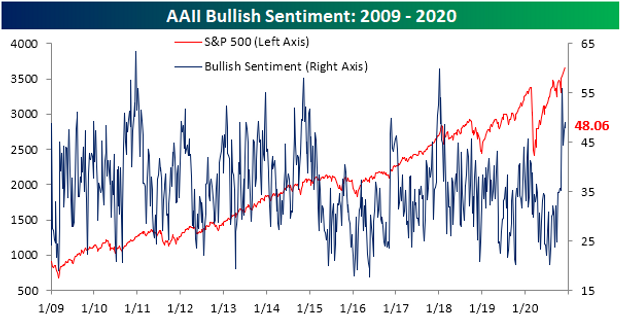
“Investor sentiment has unfortunately gotten quite bullish over the last month or so. This is something to continue to keep an eye on as we look for ‘frothiness’ in the market,” they said, highlighting the chart below overlaying the S&P 500 over the AAII bullish sentiment survey reading.
Rising bullish sentiment comes as stocks build on a historic November rally that saw the Dow Jones Industrial Average DJIA, -0.23% post its largest monthly rise since January 1987, while the S&P 500 SPX, -0.13% saw its biggest monthly rise since April. Both indexes saw their strongest November performance since 1928. Those benchmarks, the Nasdaq Composite COMP, +0.54% and the small-cap Russell 2000 RUT, +1.08% have all traded in record territory this week and are on track for solid weekly gains.
The rally has been marked by a rotation away from the highflying tech stocks that drove the rally from the pandemic-inspired bear market lows in March. Optimism over vaccines has been credited with fueling a rotation into small-cap stocks and shares of companies that stand to benefit most from a broader economic reopening, as investors look past the resurgence in COVID-19 cases that has caused renewed lockdowns in some areas and appears set to slow economic activity into year-end.
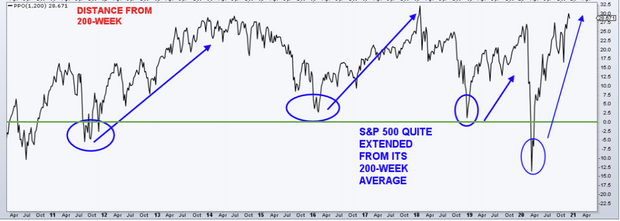
Technical analysts worry exclusively about price action. And Arbeter is concerned that the S&P 500 is already stretched.
“While price action of the major indices looks like we are in the grind higher phase, which is generally bullish unless the slope goes parabolic, the S&P 500 is very extended above its longer term moving averages (see chart below) and the index recently rose above the upper weekly Bollinger Band,” he wrote. Bollinger bands plot a standard deviation above and below a simple moving average.
Plenty of similar episodes in the past have been followed by significant pullbacks, Arbeter noted, but added that solid market breadth indicators are likely to make any significant dips a buying opportunity.
“Sooner or later, market participants with aggressive positioning will pay the piper,” he said. “For now, a nice 5% jolt to the downside would throw a little cold water on the overheated areas of the stock market and set up another run for glory.”


