


It’s no secret that Americans struggle when it comes to working with numbers. Although the United States educational system lags other nations in a number of subject areas, our performance in STEM and numbers-heavy subjects often fares the worst. The U.S. ranks in the bottom 15% of wealthy developed nations in math. And only 40% of students graduate high school with the numbers skills they’ll need to be able to succeed in college.
For many of us, the tried-and-true way of teaching quantitative subjects just isn’t adding up to actual competency.
When I was a business school student, I marveled at how easily, it seemed, many of my former financier peers were able to absorb and work with complex quantitative concepts. Formulas and dense text seemed to work for them—but they just weren’t working for me. I had to come up with my own solution.
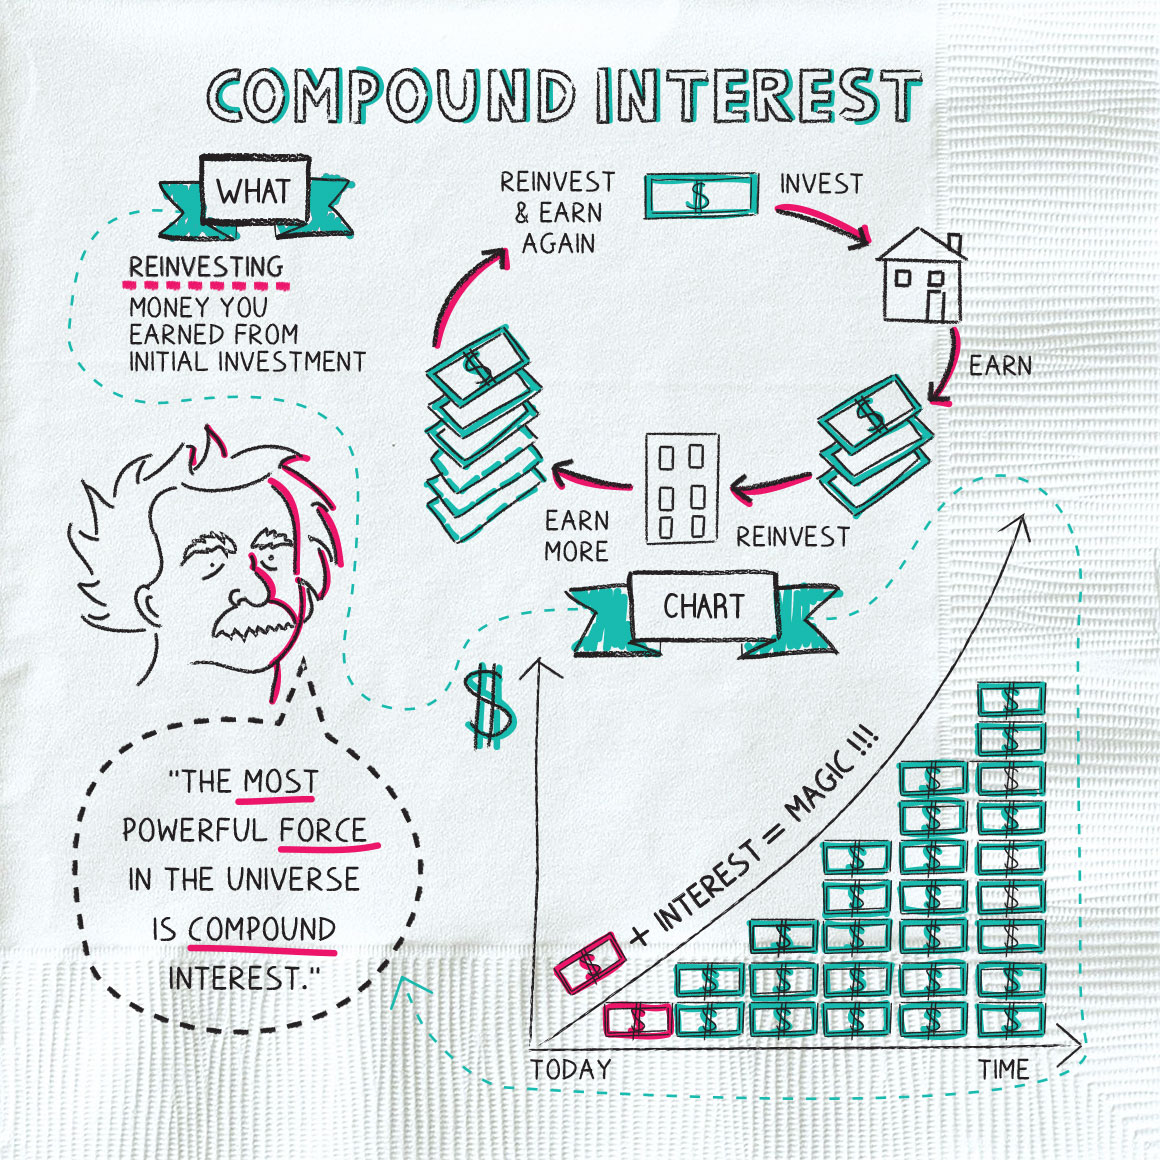
Instead of dropping out or scraping by, I started drawing. Standard deviation became an angry squiggly line, mortgage-backed security cash flows became cascading waterfalls, and returns on equity became stacks of building blocks. My notes didn’t always look like my classmates’ notes, but I was mastering the material.
But classroom struggles only tell part of the story—culture matters too.
We live in a society that has accepted finance and math as being “simply too hard” for many people—even when it comes to small tasks, such as splitting a check or shopping for a loan. Indeed, many Americans navigate their day-to-day lives trying to avoid quantitative tasks. Ask any number of well-educated professionals if they know how much they’re paying in 401(k) fees and you’ll likely get a timid shrug and an answer about not being a “numbers person.”
Why this avoidance? One answer could be fear. As many as nine in 10 Americans experience a knee-jerk, negative emotional reaction to situations involving numbers, according to widely cited research conducted at the University of Nevada. For those who experience this anxiety, merely anticipating having to do math triggers the parts of the brain that detect bodily threats and feel physical pain.
Avoidance can be a natural and understandable response to threatening situations—but Americans’ numbers phobia is doing real damage. Only 41% of Americans use a budget, and only half of those over 55 have retirement savings. In a recent financial literacy survey, only four in 10 millennials were able to choose the correct definition of “interest” out of three multiple choice options.
Why is our current approach to these subjects failing so badly in both the classroom and the real world?
One common assumption about the way our brains process math is that we work like computers: Some figures are inputted into the system, our brains seamlessly spin them through a formula, and then spit out an answer.
Emerging research, however, indicates that math is processed visually.
Stanford neuroscientists studying brain activity have found that the parts of our brains responsible for visual processing are deeply involved when solving quantitative problems. Even if there’s nothing in front of you, in other words, your brain visualizes math problems in order to work through them.
These findings hold true regardless of age and even sight ability. In one small study of three blind mathematicians—each of whom had been born blind or lost the ability to see in early childhood—the same visual processing networks were activated during quantitative problem-solving.
These conclusions make intuitive sense when you consider the visual, spatial way that children learn about numbers—through simple counting and grouping exercises using physical objects. Although most of us don’t need to count on our fingers by adulthood, in some sense we’re still doing so subconsciously.
They also make sense in the context of research that shows many people are visual learners, that infographics can be profoundly useful learning aids (and selling tools), and that our brains are hardwired to understand images with more ease and speed than other forms of communication.
 Dey Street Books
 I’ve seen these theoretical conclusions backed up with real-world results when struggling learners are finally given the visual explanations they need—instead of more lectures and formulas.
Some of those same sketches I created back in business school are now helping people as far away as India and Australia start to grasp financial concepts for the first time. I’ve used visual learning tools—including illustrations, infographics, and videos—that to help intimidated learners finally start to unpack basic financial concepts and even master harder ones. (And I’ve found that everyone—millennial or otherwise—is fully capable of mastering how interest works.)
What I’ve discovered through experience is that if numbers aren’t intimidating—if we meet people where they are, work with their natural strength in visual learning, and take the explanation of quantitative concepts back to the intuitive spatial way we all learned in childhood—then anyone, truly anyone, can be a numbers person
So the next time you need to split a check, grab it with confidence and take a stab at drawing your way through it. And if anyone raises an eyebrow at why you’re doodling your way through a stack of napkins—just tell them you’re a visual learner.
Tina Hay is the founder of Napkin Finance, a platform for users of all ages to learn finance in a simple and engaging way, and the author of “Napkin Finance: Build Your Wealth in 30 Seconds or Less”.
div > iframe { width: 100% !important; min-width: 300px; max-width: 800px; } ]]>


