


(Updates story with year-end closing prices and consensus price targets.)
During the stock market’s March plunge, it may have been difficult for you to expect 2020 to end up as a good year for stocks, but incredibly low interest rates from the Federal Reserve, unprecedented federal spending to support the economy and investors’ enthusiasm for technology stocks did just that.
While many stocks did well, 198 of the S&P 500 Index’s SPX, +0.64% components lost ground in 2020. Further down in this article, you’ll find a list of the 20 worst-performing S&P stocks. While Wall Street analysts remain downbeat on some of them for 2021, they foresee a significant recovery for others — particularly in one industry.
Here’s how the 11 sectors of the S&P 500 performed in 2020, as the benchmark rose 16.3%:
| Index | Price change – 2020 |
| Information Technology | 42.2% |
| Consumer Discretionary | 32.1% |
| Communication Services | 22.2% |
| Materials | 18.1% |
| Health Care | 11.4% |
| Industrials | 9.0% |
| Consumer Staples | 7.6% |
| Utilities | -2.8% |
| Financials | -4.1% |
| Real Estate | -5.2% |
| Energy | -37.3% |
| Source: FactSet | |
The coronavirus recession caused demand for oil to plummet, as the cruise industry has shut down and commercial air flights have plummeted. But production cuts have improved the balance between supply and demand. Here’s a chart showing continuous front-month futures quotes for West Texas crude oil this year:
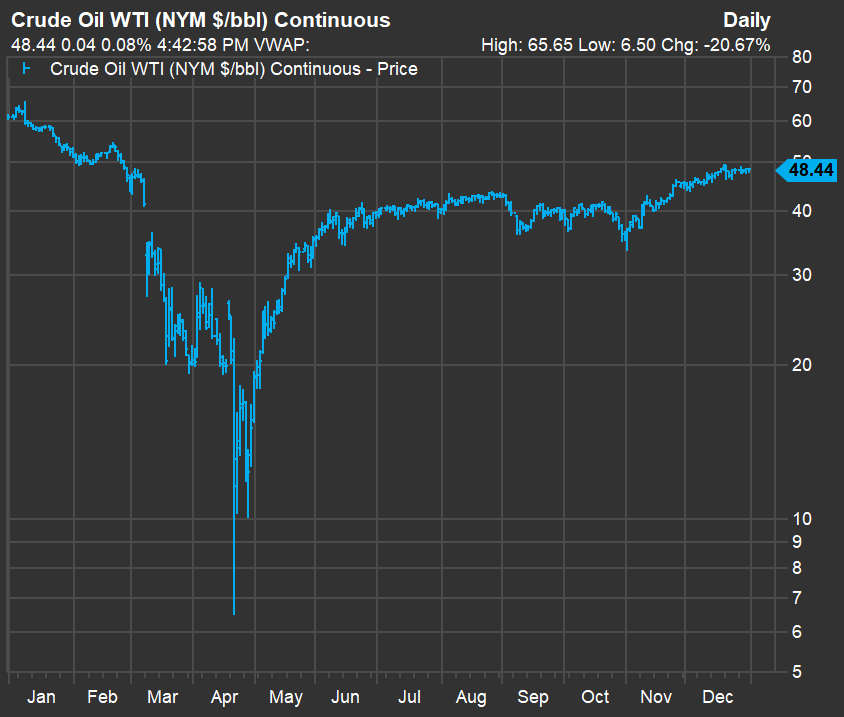
That’s a remarkable recovery; however, WTI still fell 21% in 2020. This explains why energy-sector companies make up more than half of the year’s list of the 20 worst-performing S&P 500 stocks through Dec. 28:
| Company | Ticker | Industry | Price change – 2020 |
| Occidental Petroleum Corp. | OXY, -3.35% | Oil & Gas Production | -58% |
| Carnival Corp. | CCL, -0.60% | Hotels/Resorts/Cruiselines | -57% |
| Norwegian Cruise Line Holdings Ltd. | NCLH, -0.82% | Hotels/Resorts/Cruiselines | -56% |
| TechnipFMC PLC | FTI, -2.29% | Oilfield Services/Equipment | -56% |
| United Airlines Holdings Inc. | UAL, -3.14% | Airlines | -51% |
| Marathon Oil Corp. | MRO, -1.91% | Oil & Gas Production | -51% |
| Oneok Inc. | OKE, +0.68% | Oil & Gas Pipelines | -49% |
| HollyFrontier Corp. | HFC, -0.88% | Oil Refining/Marketing | -49% |
| Diamondback Energy Inc. | FANG, -1.77% | Oil & Gas Production | -48% |
| Schlumberger NV | SLB, -0.23% | Oilfield Services/Equipment | -46% |
| National Oilwell Varco Inc. | NOV, -0.65% | Oilfield Services/Equipment | -45% |
| American Airlines Group Inc. | AAL, -2.35% | Airlines | -45% |
| Apache Corp. | APA, -2.61% | Oil & Gas Production | -45% |
| Royal Caribbean Group | RCL, +1.27% | Hotels/Resorts/Cruiselines | -44% |
| Wells Fargo & Company | WFC, +1.45% | Major Banks | -44% |
| Vornado Realty Trust | VNO, +2.50% | Real Estate Investment Trusts | -44% |
| Simon Property Group Inc. | SPG, +1.56% | Real Estate Investment Trusts | -43% |
| Exxon Mobil Corp. | XOM, -0.91% | Integrated Oil | -41% |
| EOG Resources Inc. | EOG, -1.36% | Oil & Gas Production | -40% |
| Valero Energy Corp. | VLO, -0.26% | Oil Refining/Marketing | -40% |
| Source: FactSet | |||
Scroll the table to see all the data.
You can click on the tickers for more about each company, including news coverage, charts, financial data and price ratios.
Here’s a summary of Wall Street analysts’ opinions about these stocks:
| Company | Ticker | Share ‘buy’ ratings | Share neutral ratings | Share ‘sell’ ratings | Closing price – Dec. 31 | Consensus price target | Implied 12-month upside potential |
| Occidental Petroleum Corp. | OXY, -3.35% | 17% | 66% | 17% | $17.31 | $16.73 | -3% |
| Carnival Corp. | CCL, -0.60% | 11% | 68% | 21% | $21.66 | $17.95 | -17% |
| Norwegian Cruise Line Holdings Ltd. | NCLH, -0.82% | 35% | 59% | 6% | $25.43 | $22.46 | -12% |
| TechnipFMC PLC | FTI, -2.29% | 70% | 23% | 7% | $9.40 | $10.90 | 16% |
| United Airlines Holdings Inc. | UAL, -3.14% | 39% | 44% | 17% | $43.25 | $46.29 | 7% |
| Marathon Oil Corp. | MRO, -1.91% | 33% | 54% | 13% | $6.67 | $7.78 | 17% |
| Oneok Inc. | OKE, +0.68% | 32% | 56% | 12% | $38.38 | $37.30 | -3% |
| HollyFrontier Corp. | HFC, -0.88% | 36% | 53% | 11% | $25.85 | $29.44 | 14% |
| Diamondback Energy Inc. | FANG, -1.77% | 90% | 10% | 0% | $48.40 | $60.03 | 24% |
| Schlumberger NV | SLB, -0.23% | 70% | 27% | 3% | $21.83 | $24.84 | 14% |
| National Oilwell Varco Inc. | NOV, -0.65% | 44% | 40% | 16% | $13.73 | $13.42 | -2% |
| American Airlines Group Inc. | AAL, -2.35% | 18% | 27% | 55% | $15.77 | $11.36 | -28% |
| Apache Corp. | APA, -2.61% | 39% | 58% | 3% | $14.19 | $16.00 | 13% |
| Royal Caribbean Group | RCL, +1.27% | 33% | 50% | 17% | $74.69 | $67.54 | -10% |
| Wells Fargo & Company | WFC, +1.45% | 48% | 48% | 4% | $30.18 | $33.89 | 12% |
| Vornado Realty Trust | VNO, +2.50% | 23% | 46% | 31% | $37.34 | $41.55 | 11% |
| Simon Property Group Inc. | SPG, +1.56% | 35% | 65% | 0% | $85.28 | $92.00 | 8% |
| Exxon Mobil Corp. | XOM, -0.91% | 27% | 61% | 12% | $41.22 | $48.50 | 18% |
| EOG Resources Inc. | EOG, -1.36% | 74% | 26% | 0% | $49.87 | $63.47 | 27% |
| Valero Energy Corp. | VLO, -0.26% | 91% | 4% | 5% | $56.57 | $64.11 | 13% |
| Source: FactSet | |||||||
So five of these companies have majority “buy” ratings, with analysts expecting the shares to rise by double digits over the next year. All are involved in oil or natural gas production or refining.
As always, if you see any stocks of interests, it’s important to do your own research to form your own opinion about a company’s prospects.
For more about 2020, click here for a list of this year’s best-performing stocks in the U.S. and here for a list of big winners that aren’t yet included in the S&P 500 or the Nasdaq-100 NDX, +0.33% indexes.
Don’t miss:20 of analysts’ favorite large-cap stocks for 2021, including GM, Facebook and Salesforce


