


Billionaire investor Ray Dalio last week reminded investors what’s important about China: Its rapid and sustained economic growth is so important that it’s risky not to invest there.
He also compared the scope of China’s rise to that of the British Empire and to the industrial revolution.
Chinese stocks have broadly underperformed U.S. stocks for many years. But over the next decade, you might be well-served by diversifying your holdings and investing at least some of your money in the most populous country.
Use fear to your advantage
Investing in China is thought to be risky, not least because of the daily dose of frightening headlines about the U.S.-China trade conflict or the unrest in Hong Kong:
• When the unthinkable happens: U.S.-China trade negotiations break down for good
• Hong Kong protests hit London markets
• Trade war is raising the risk of U.S. recession, Goldman Sachs warns
• One man stands between us and a currency war
That’s not to say there isn’t any risk. But when is fear overdone?
China ETF
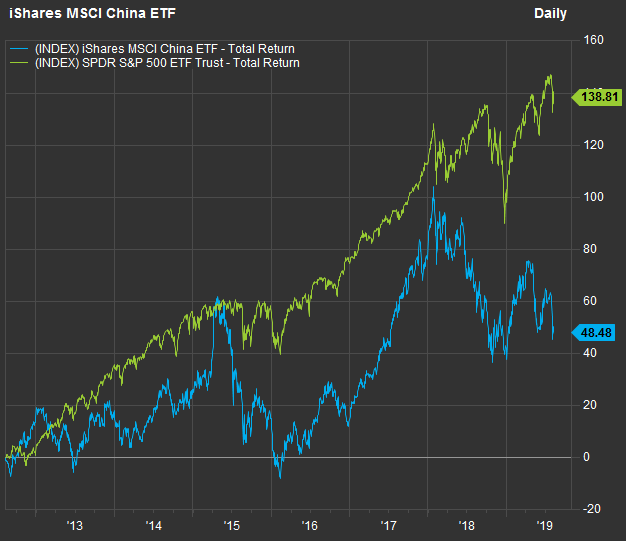
The iShares MSCI China ETF MCHI, -0.82% tracks the MSCI China Index, which includes 390 stocks of Chinese companies that are available to international investors. For stocks or American depositary receipts (ADRs) listed on U.S. exchanges, the U.S. tickers are used.
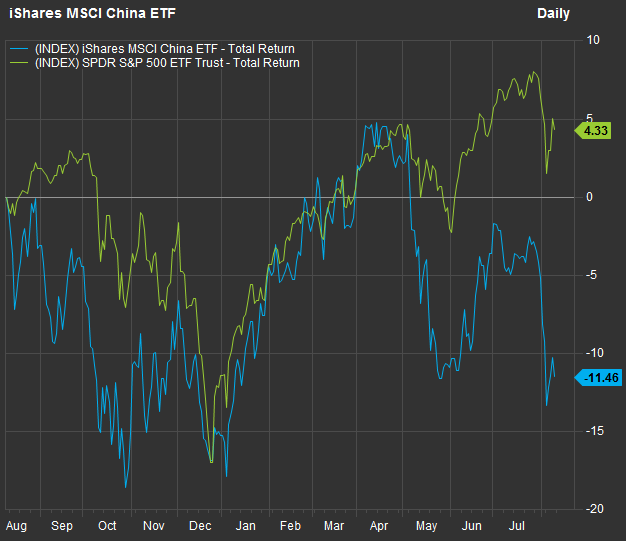
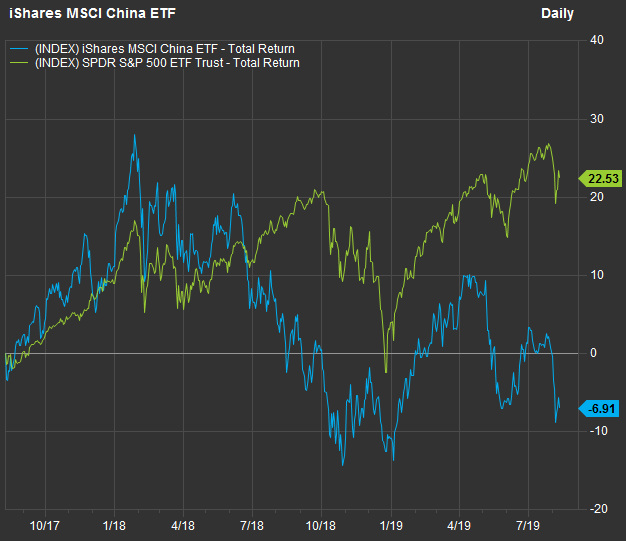
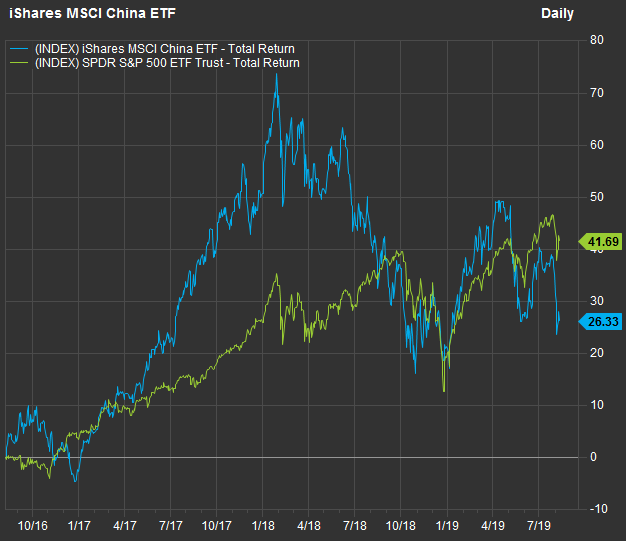
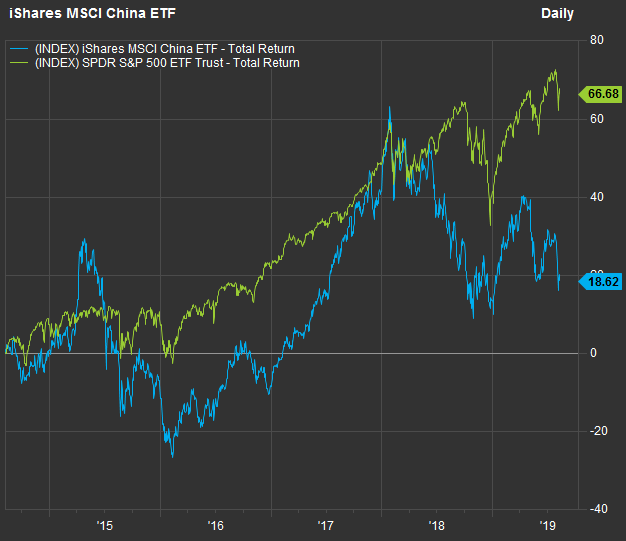
To put things into perspective, here are several charts comparing the performance of MCHI, which was established March 29, 2011, to the SPDR S&P 500 ETF SPY, -0.71%.
First, a one-year chart through Aug. 9:
 FactSet
Now two years:
 FactSet
Three years:
 FactSet
Five years:
 FactSet
Seven years:
 FactSet
So SPY has soundly beaten MCHI for all periods. But there are a few of things to keep in mind:
• U.S. stocks have been on an upward path since the post-crisis bottom in March 2009, in great part because of low interest rates at home and, more recently, negative interest rates in other developed economies. Central banks’ policies have made the world awash with more cash than ever, and the U.S. stock market is considered a relatively safe haven.
• Another important thing to consider is how much easier it has gotten for foreign investors to buy stocks listed in China. MSCI began including the “A shares” (the locally listed shares that weren’t available to investors outside China until rules were eased) in its indexes in May 2018. This potentially means tremendous outside support for companies based in China.
• Despite the current pessimism, there may eventually be a tariff-killing trade deal between the U.S. and China. It may even be possible for us to see one soon, according to analysts at Credit Suisse.
It is fascinating that a good deal of the volatility for China stocks has surrounded the continued narrative of slowing economic growth. Even so, China’s second-quarter annualized GDP growth rate of 6.2% — its worst in at least 27 years — looks favorable when compared with the 2.1% pace for the U.S. and an anemic 0.2% in the eurozone.
So there is plenty to think about. But it is reasonable to be diversified and include China, especially if you are looking to build a nest egg over the next decade or three.
Largest MCHI holdings
A broad ETF investment may be the best way for you to gain exposure to China. But that approach isn’t for everyone, and you can see that shares of many of the largest publicly traded Chinese companies have performed well. Here are the 20 largest holdings of the iShares MSCI China ETF:
| Company | Ticker | Share of MCHI | Industry | Total return – 2019 through Aug. 9 | Total return – 3 years | Total return – 5 years |
| Tencent Holdings Ltd. | 700, +0.47% | 15.2% | Internet Software/ Services | 8% | 81% | 164% |
| Alibaba Group Holding Ltd. ADR | BABA, -0.18% | 14.0% | Internet Retail | 16% | 87% | N/A |
| China Construction Bank Corp. Class H | 939, +0.53% | 4.3% | Major Banks | -7% | 21% | 29% |
| Ping An Insurance (Group) Co. of China Ltd. Class H | 2318, +0.46% | 3.9% | Multi-Line Insurance | 28% | 150% | 200% |
| China Mobile Ltd. | 941, -0.54% | 3.1% | Wireless Telecommunications | -12% | -22% | -6% |
| Industrial and Commercial Bank of China Ltd. Class H | 941, -0.54% | 2.6% | Major Banks | -6% | 27% | 27% |
| Bank of China Ltd. Class H | 3988, -0.33% | 1.9% | Major Banks | -5% | 8% | 10% |
| Baidu, Inc. ADR Class A | BIDU, -2.05% | 1.7% | Internet Software/ Services | -39% | -41% | -55% |
| Cnooc Ltd. | 883, -0.68% | 1.7% | Oil & Gas Production | 1% | 44% | 5% |
| JD.com, Inc. ADR Class A | JD, +0.31% | 1.2% | Internet Retail | 29% | 21% | -4% |
| China Merchants Bank Co. Ltd. Class H | 3968, +0.83% | 1.1% | Regional Banks | 30% | 129% | 187% |
| NetEase, Inc. ADR | NTES, -2.20% | 1.1% | Internet Software/ Services | 4% | 26% | 211% |
| China Life Insurance Co. Ltd. Class H | 2628, -0.33% | 1.1% | Life/ Health Insurance | 10% | 4% | -13% |
| Yum China Holdings, Inc. | YUMC, -1.16% | 1.0% | Restaurants | 31% | N/A | N/A |
| China Petroleum & Chemical Corp. Class H | 386, -0.64% | 1.0% | Integrated Oil | -11% | 4% | -17% |
| New Oriental Education & Technology Group, Inc. ADR | EDU, -0.65% | 0.9% | Other Consumer Services | 89% | 145% | 455% |
| Ctrip.com International Ltd. ADR | CTRP, -2.79% | 0.9% | Other Consumer Services | 25% | -25% | 3% |
| China Overseas Land & Investment Ltd. | 688, -0.40% | 0.8% | Real Estate Development | -5% | 3% | 31% |
| TAL Education Group ADR Class A | TAL, +0.75% | 0.7% | Other Consumer Services | 21% | 225% | 503% |
| Agricultural Bank of China Ltd. Class H | 1288, +0.33% | 0.7% | Regional Banks | -7% | 20% | 9% |
| China Resources Land Ltd. | 1109, -0.49% | 0.7% | Real Estate Development | 6% | 60% | 122% |
| Source: FactSet | ||||||
Forward price-to-earnings ratios (based on sell-side analysts earnings estimates for the next 12 reported months) aren’t available form FactSet for all of the companies. However, many of the ratios have declined significantly over the past year:
| Company | Ticker | Forward price/ earnings ratio | Forward P/E – 12 months ago |
| Tencent Holdings Ltd. | 700, +0.47% | 30.1 | 35.6 |
| Alibaba Group Holding Ltd. ADR | BABA, -0.18% | 24.2 | 29.8 |
| China Construction Bank Corp. Class H | 939, +0.53% | N/A | 5.3 |
| Ping An Insurance (Group) Co. of China Ltd. Class H | 2318, +0.46% | N/A | 13.9 |
| China Mobile Ltd. | 941, -0.54% | N/A | N/A |
| Industrial and Commercial Bank of China Ltd. Class H | 1398, +0.00% | N/A | 5.6 |
| Bank of China Ltd. Class H | 3988, -0.33% | N/A | 4.9 |
| Baidu, Inc. ADR Class A | BIDU, -2.05% | 23.0 | 20.2 |
| Cnooc Ltd. | 883, -0.68% | N/A | N/A |
| JD.com, Inc. ADR Class A | JD, +0.31% | 40.5 | 47.2 |
| China Merchants Bank Co. Ltd. Class H | 3968, +0.83% | N/A | 7.8 |
| NetEase, Inc. ADR | NTES, -2.20% | 19.7 | 19.9 |
| China Life Insurance Co. Ltd. Class H | 2628, -0.33% | 8.9 | 12.4 |
| Yum China Holdings, Inc. | YUMC, -1.16% | 24.3 | 24.4 |
| China Petroleum & Chemical Corp. Class H | 386, -0.64% | 9.2 | 10.8 |
| New Oriental Education & Technology Group, Inc. ADR | EDU, -0.65% | 35.1 | 33.9 |
| Ctrip.com International Ltd. ADR | CTRP, -2.79% | 25.2 | 37.0 |
| China Overseas Land & Investment Ltd. | 688, -0.40% | N/A | N/A |
| TAL Education Group ADR Class A | TAL, +0.75% | 46.7 | 76.2 |
| Agricultural Bank of China Ltd. Class H | 1288, +0.33% | 4.4 | 4.9 |
| China Resources Land Ltd. | 1109, -0.49% | N/A | N/A |
| Source: FactSet | |||
Here’s a summary of analysts’ opinions of the companies:
| Company | Ticker | Share ‘buy’ ratings | Share neutral ratings | Share ‘sell’ ratings |
| Tencent Holdings Ltd. | 700, +0.47% | 90% | 10% | 0% |
| Alibaba Group Holding Ltd. ADR | BABA, -0.18% | 98% | 2% | 0% |
| China Construction Bank Corp. Class H | 939, +0.53% | 94% | 6% | 0% |
| Ping An Insurance (Group) Co. of China Ltd. Class H | 2318, +0.46% | 95% | 5% | 0% |
| China Mobile Ltd. | 941, -0.54% | 57% | 29% | 14% |
| Industrial and Commercial Bank of China Ltd. Class H | 1398, +0.00% | 86% | 14% | 0% |
| Bank of China Ltd. Class H | 3988, -0.33% | 83% | 17% | 0% |
| Baidu, Inc. ADR Class A | BIDU, -2.05% | 57% | 43% | 0% |
| Cnooc Ltd. | 883, -0.68% | 89% | 11% | 0% |
| JD.com, Inc. ADR Class A | JD, +0.31% | 60% | 40% | 0% |
| China Merchants Bank Co. Ltd. Class H | 3968, +0.83% | 65% | 22% | 13% |
| NetEase, Inc. ADR | NTES, -2.20% | 75% | 25% | 0% |
| China Life Insurance Co. Ltd. Class H | 2628, -0.33% | 83% | 13% | 4% |
| Yum China Holdings, Inc. | YUMC, -1.16% | 79% | 21% | 0% |
| China Petroleum & Chemical Corp. Class H | 386, -0.64% | 75% | 25% | 0% |
| New Oriental Education & Technology Group, Inc. ADR | EDU, -0.65% | 93% | 7% | 0% |
| Ctrip.com International Ltd. ADR | CTRP, -2.79% | 78% | 19% | 3% |
| China Overseas Land & Investment Ltd. | 688, -0.40% | 100% | 0% | 0% |
| TAL Education Group ADR Class A | TAL, +0.75% | 57% | 43% | 0% |
| Agricultural Bank of China Ltd. Class H | 1288, +0.33% | 81% | 19% | 0% |
| China Resources Land Ltd. | 1109, -0.49% | 88% | 12% | 0% |
| Source: FactSet | ||||
That’s an amazing set of positive opinions for these stocks. Most sell-side analysts are basing their ratings on 12-month outlooks, but the volatility in the performance tables near the top of this article make it clear that any one-year period can be brutal.
Because of the lack of uniformity in the reporting, we have not included sales growth figures. If you are interested in any of the companies individually, it is important for you to do your own research to form your own opinion about the company’s business strategy and long-term prospects.
Don’t miss: Here’s a real contrarian play to take advantage of other investors’ fear
Create an email alert for Philip van Doorn’s Deep Dive columns here.


