


Kimball Brooker says he and his co-managers at the $50 billion First Eagle Global Fund use an insurance term to refer to their process of assessing companies for investment: underwriting.
The word is “taken from insurance or lending, because in those industries you are most focused on the severity of loss,” he said in a phone interview Sept. 19. “This is different from most equity managers, who are only focused on returns. They talk all the time about the returns they are looking to get.”
Brooker is First Eagle Investment Management’s deputy head of global value. Matthew McLennan, who heads the firm’s global value team, is also a portfolio manager for the First Eagle Global Fund SGENX, +0.09%. Manish Gupta serves as associate portfolio manager. The firm has about $102 billion in assets under management.
Read: Worried about the stock market? Here are easy ways to cut risk
Talk of investing risks has reached a fever pitch. We’re reminded daily of the trade conflict between the U.S. and China, the uncertainty over Brexit and what it may mean for the stability of the European Union, and Europe’s anemic economy and the European Central Bank’s ineffectiveness. There is even new military risk to worry about, as evidenced by the recent drone attack against Saudi Arabia’s oil facilities.
You may have money invested in the benchmark S&P 500 Index SPX, -0.01% through a low-cost index fund within an employer-sponsored retirement plan because performance has been spectacular in the past 10 years. The index is weighted by market capitalization, which means you are not only concentrated in the U.S., you have 17% of your investment in the five companies with the highest market values: Microsoft MSFT, -0.22%, Apple AAPL, +0.45%, Amazon.com AMZN, -0.49%, Alphabet GOOG, +0.33% GOOGL, +0.39% and Facebook FB, -1.64%.
You might think it reasonable to broaden your horizons with an international index fund — maybe the iShares MSCI World Index ETF XWD, -0.21% or the iShares MSCI EAFE ETF EFA, -0.26%. (EAFE stands for developed economies in Europe, Australia, Asia and the Far East.)
But an actively managed approach to international investing, despite higher expenses, might solve the problems of cap-weighting, over-concentration in the U.S. and elevated valuations for many of the largest components of the indexes.
First Eagle says its Global Fund is run in an “index agnostic” manner. However, its performance benchmark is the MSCI World Index. The fund had an 85.8% active share through the second quarter. The higher the active share, the more a fund’s portfolio is differentiated from the index — and this is a very high active share.
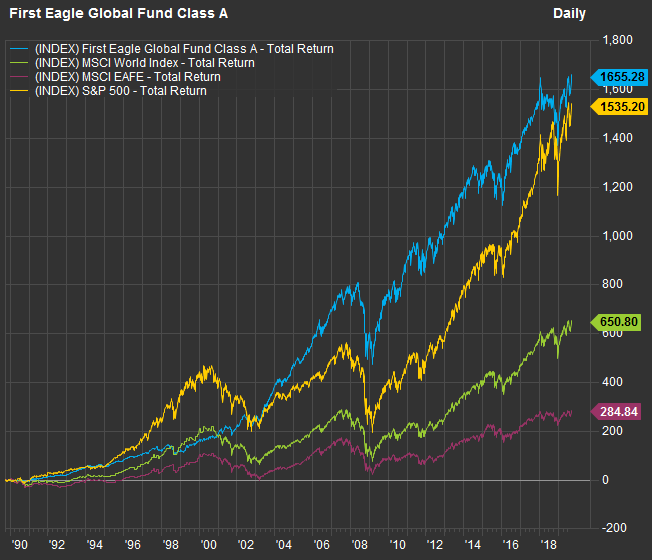
Here’s a 30-year chart showing the performance (after expenses) of the First Eagle Global Fund’s Class A shares against the two international indexes tracked by the ETFs named above, and the S&P 500:
 FactSet
 The First Eagle Global Fund’s Class A shares have a 5% sales charge in the fund’s prospectus. That fee is waived at mutual fund “supermarkets,” including Charles Schwab, Fidelity, E-Trade and Ameritrade. The Class A sales charge is not waived for clients on major brokerage platforms. Still, customers with advisory relationships would be directed to the Class I shares, which have no sales charge.
In the 30-year chart, you can see that the fund performed better than the other three indexes, but was particularly strong against the MSCI World Index.
In the interview, Brooker said: “What you don’t own in a portfolio can be more helpful than what you own. A lot of times [during severe market declines] when we were not exposed to certain parts of the market, those were well-represented in the index.”
He continued: “One of the dangers of relying too much on indices … is you end up owning, typically, the most popular segments of a given market, which can sometimes be overpriced as a group.”
According to First Eagle, the Global Fund’s exposure to the technology sector was less than 5% at the end of 1999, while the MSCI World Index was 32.5% concentrated in the sector. As of Dec. 31, 2006, the fund had less than 2% exposure to financial stocks, compared with 26.4% for the index.
The 30-year chart, of course, encompasses the full dot-com boom-and-bust cycle, as well as the 2008-2009 financial crisis and recovery.
Going all the way back to January 1979, First Eagle provided these upside/downside capture numbers through 2018:
| First Eagle Global Fund – upside capture | First Eagle Global Fund – downside capture | |
| MSCI World Index | 72% | 42% |
| MSCI EAFE Index | 50% | 28% |
| S&P 500 | 67% | 42% |
| Source: First Eagle Investment Management | ||
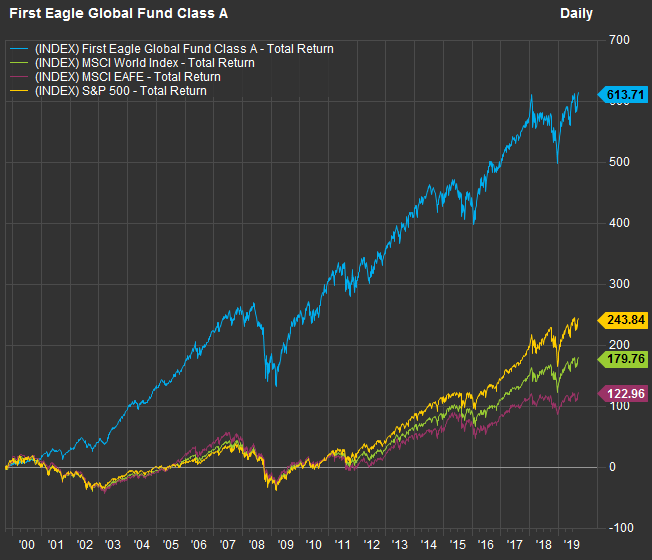
The 20-year chart shows the fund again outperforming greatly:
 FactSet
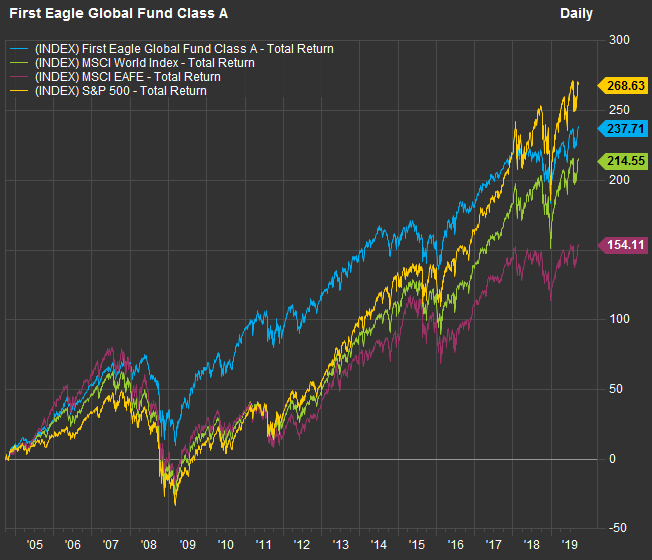
 For 15 years, the fund trails the S&P 500 but is still ahead of the two international indexes:
 FactSet
 So the fund has trailed the recent period of fantastic growth for so many of the largest U.S. tech companies.
Here are average returns for the fund against the indexes for various periods:
| Total return – 2019 through Sept. 20 | Average return – 5 years | Average return – 10 years | Average return – 15 years | Average return – 20 years | Average return – 30 years | |
| First Eagle Global Fund | 15.5% | 5.3% | 7.7% | 8.5% | 10.2% | 10.0% |
| MSCI World Index | 19.6% | 8.7% | 10.5% | 7.9% | 5.3% | 7.0% |
| MSCI EAFE Index | 16.5% | 6.3% | 7.5% | 6.4% | 4.1% | 4.6% |
| S&P 500 Index | 21.1% | 10.5% | 13.2% | 9.0% | 6.1% | 9.8% |
| Source: FactSet | ||||||
For the longer periods, some of the differences between the average returns may seem small, but you can see on the first chart that these differences really add up over long periods.
Portfolio and selection
As of July 31, the First Eagle Global Fund was 14.7% in cash and equivalents. McLennan, who heads the firm’s global value team, said during a meeting Sept. 17 that the fund’s current positioning reflected its “counter-cyclical” approach to cash — building it up when market valuations are elevated (with the S&P 500 near its record high) and deploying cash when valuations are low.
Here are the fund’s top 10 investing positions as of July 31:
| Name | Ticker | Share of portfolio | Country | Industry |
| Gold bullion | 9.6% | |||
| Oracle Corp. | ORCL | 2.4% | U.S. | Software |
| Comcast Corp. Class A | CMCSA | 2.0% | U.S. | Cable/Satellite TV |
| Exxon Mobil Corp. | XOM | 1.8% | U.S. | Integrated Oil |
| Schlumberger NV | SLB | 1.6% | U.S. | Oilfield Services/Equipment |
| Fanuc Corp. | 6954-JP | 1.5% | Japan | Industrial Machinery |
| Weyerhaeuser Co. | WY | 1.5% | U.S. | Real Estate Investment Trusts |
| Danone SA | BN-FR | 1.4% | France | Food: Major Diversified |
| KDDI Corp. | 9433-JP | 1.4% | Japan | Wireless Telecommunications |
| Sompo Holdings,Inc. | 8630-JP | 1.4% | Japan | Property/Casualty Insurance |
| Sources: First Eagle Investment Management, FactSet | ||||
The fund was 9.6% in gold bullion, and 4.2% in gold-mining companies. When discussing gold, McLennan said developed economies have been growing their money supply more rapidly than GDP, while the supply of gold grows slowly, underlining its value as a hedge.
“We have about 150 securities in the fund,” Brooker said. “It is very diversified. We really are not believers in the concentration mantra.”
So the heavy representation of the U.S. in the above list of top holdings isn’t especially meaningful. Here’s the fund’s breakdown by region as of July 31:
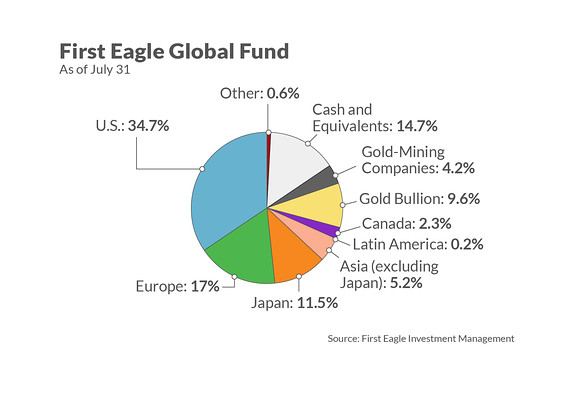 MarketWatch Illustration. Data source: First Eagle Investment Management.
 Brooker said First Eagle’s bottom-up approach to stock selection emphasizes valuation, quality and something less tangible: the long-term durability of each company’s business: “Either the over-valuation or the lack of quality keeps us out of the companies that usually get themselves in the most trouble during a downturn,” he said.
When the managers make a selection, First Eagle’s average holding period for a stock is about 10 years, he said.
Two examples
Brooker named two companies held by the First Eagle Global Fund as examples that meet the valuation, quality and durability criteria:
Bank of New York Mellon BK, +0.84% is technically a bank, but very much focused on fee-based services that act as “Wall Street plumbing,” Brooker said. These include various investment services and management businesses. Brooker called the stock’s valuation “compelling.” According to FactSet, the stock is trading for 11.4 times consensus earnings estimates for the next 12 months, compared with average forward price-to-earnings ratios of 13 over the past five years.
Brooker said the bank’s returns on average tangible equity have been “quite good.” Looking at data provided by FactSet for the 24 components of the KBW Bank Index BKX, +0.17%, Bank of New York Mellon’s returns on average tangible common equity have ranged from 22.78% to 27.35% over the past four quarters. None of the other components of the benchmark U.S. banking index have come close to that performance. However, the low figure is for the second quarter, showing how declining interest rates have lowered the bank’s returns.
The other example was Groupe Bruxelles Lambert GBLB, +0.32% GBLBY, +1.67% of Belgium, which “holds half a dozen blue-chip companies,” Brooker said, and is controlled by the Frère and Desmarais families.
“We have a bias toward family-owned or controlled businesses — they have longer time frames. They care about their reputations and tend not to do things that are too risky or short-sighted,” Brooker said.
Companies that Groupe Bruxelles Lambert holds stakes in range from Pernod Ricard to Adidas. GBLB, +0.32%
Don’t miss: How to profit from the ‘best of both worlds’ in stock investing
Create an email alert for Philip van Doorn’s Deep Dive columns here.


