


The S&P 500’s total return over the next decade will be just 1.9% annualized — including reinvested dividends.
That’s the conclusion of a stock market forecasting model that its author, with much justification, calls “The Single Greatest Predictor of Future Stock Market Returns.” Based on the latest data from the Federal Reserve, released in late September, my updated version of this model forecasts that the dividend-adjusted S&P 500 SPX, -0.48% will beat inflation over the next decade by an annualized margin of just 0.59 percentage points.
Add in expected inflation over the next decade of 1.35%, according to a model maintained by the Cleveland Federal Reserve, and you arrive at a nominal total return projection of 1.94% annualized.
“ If the forecast is accurate, then the S&P 500 will produce a price-only annualized 10-year return of just 0.27%. ”
To put that in perspective, consider that this projected return is less than one-fifth of the stock market’s long-term average return of about 10% annualized. To put this forecast in another context, consider that the S&P 500’s dividend yield currently is 1.67%, according to S&P Dow Jones Indices. If the forecast is accurate, then the S&P 500 will produce a price-only annualized 10-year return of just 0.27%.
Given where the S&P 500 was trading last June 30, this projection translates into the index trading at 3,185 on June 30, 2030. That’s 2% below where it was trading in late September 2020.
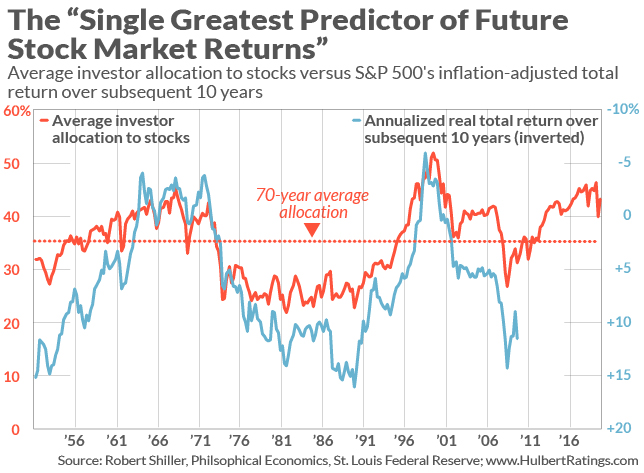
What is this model with such an impressive record? It is based on the average investor’s equity allocation. The most recent Federal Reserve data we have is for the period ending June 30; of the total amount that investors owned in stocks, bonds or cash as of then, 43.2% was invested in stocks. That’s markedly higher than the seven-decade average of 35% — as you can see from the chart below.
The chart also shows the remarkable correlation between this average investor equity allocation and the S&P 500’s inflation-adjusted total return over the subsequent decade. Note that the chart’s right axis is inverted, with higher returns at the bottom and lower returns at the top. That’s because higher average investor equity allocations are correlated with lower subsequent stock market returns.
Credit for creating this indicator goes to the anonymous author of the Philosophical Economics blog. He justified his claim that it was the “Single Greatest Predictor of Future Stock Market Returns” by calculating a statistic known as the r-squared. This statistic measures the extent to which one data series (in this case the average investor equity allocation) explains or predicts another (in this case the S&P 500’s subsequent 10-year return). The r-squared was significantly higher than for any of the other well-known valuation indicators, such as the ratios of price to earnings, book value, sales, cash flow, dividends and so forth.
I conducted similar statistical tests for a Wall Street Journal column I wrote two years ago. Average investor equity allocation indeed came out ahead of the seven other valuation indicators I analyzed.
Upon updating those tests to include date through Jun. 30, the r-squared I calculate for the average investor equity allocation is an impressively high 71%. That means quarterly changes in that allocation predict 71% of quarterly changes in the S&P 500’s subsequent 10-year return. No other indicator that I know of does a better job. (In fact, most of the indicators that capture Wall Street’s attention have an r-squared that is statistically indistinguishable from 0.)
Notice, however, that the indicator’s 71% r-squared this means that 29% of quarterly changes in the stock market’s 10-year return are uncorrelated with the average investor equity allocation. That gives the bulls a tiny bit of wriggle room to get out from the underneath the full weight of model’s dismal projection.
But only a tiny bit. The model’s overall projection is clear: The stock market over the next decade will be a below-average performer.
Mark Hulbert is a regular contributor to MarketWatch. His Hulbert Ratings tracks investment newsletters that pay a flat fee to be audited. He can be reached at [email protected]
More:Here’s the shocking truth about Robinhood investors vs. Wall Street stock pros
Plus: The ‘Single Greatest Predictor of Future Stock Market Returns’ has a message for us from 2030


