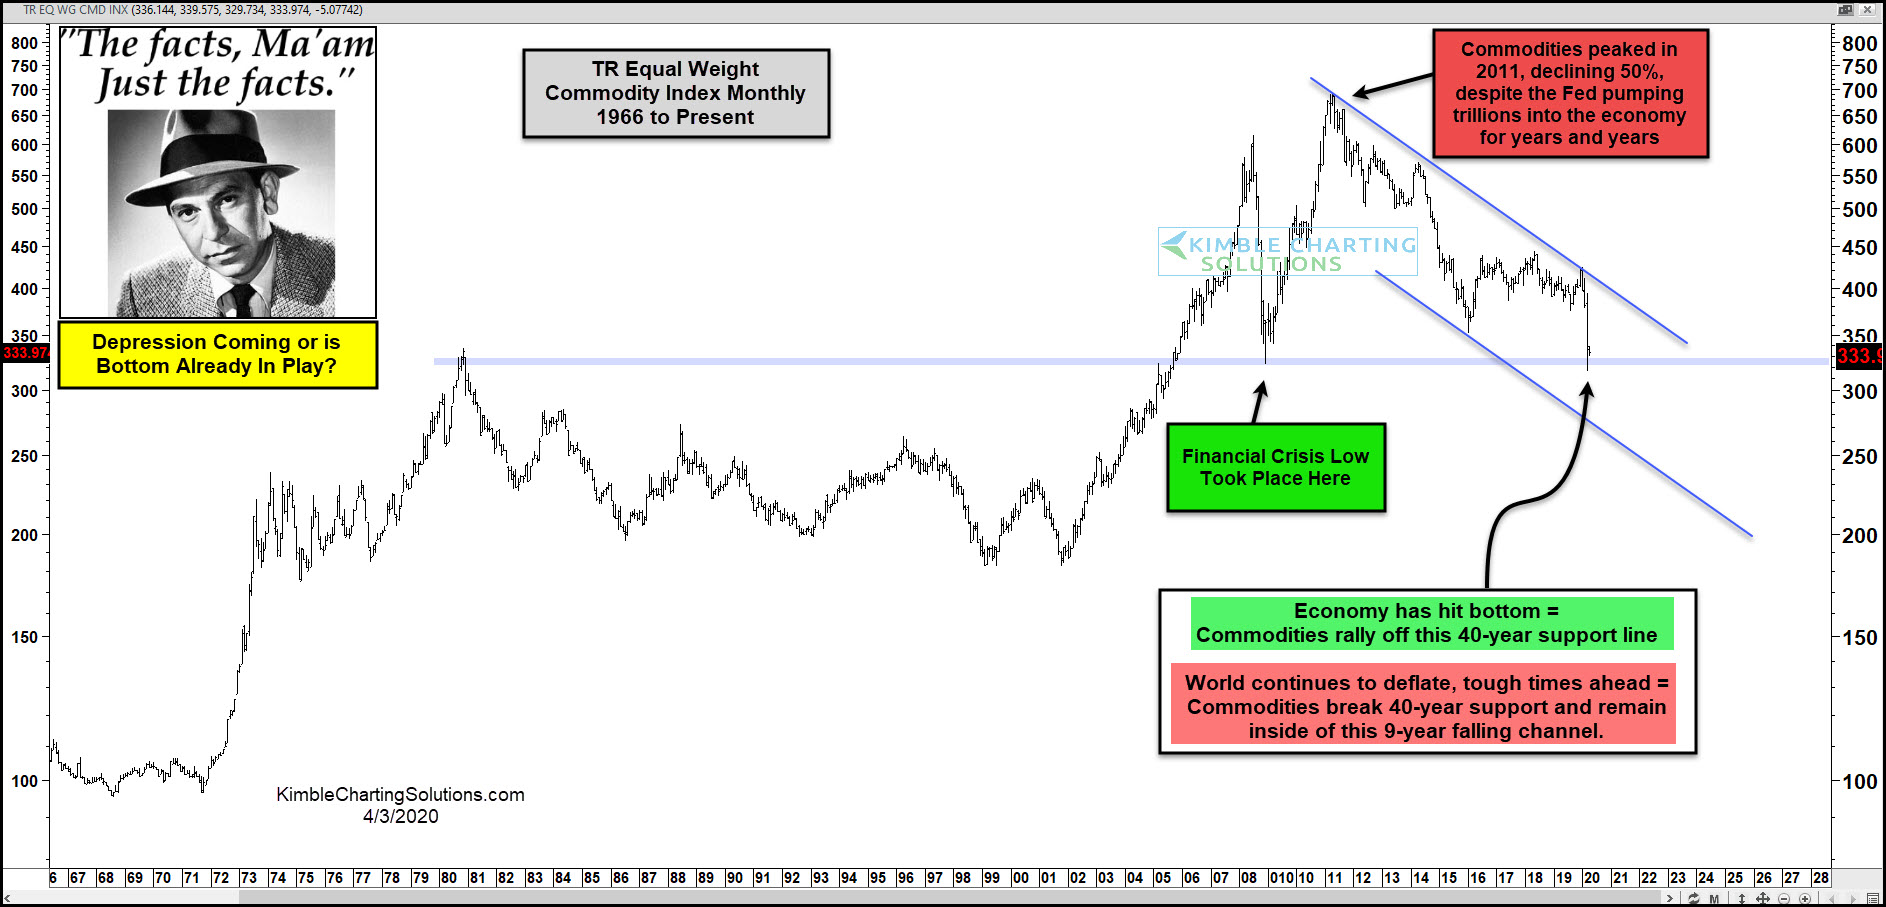
Investors say there’s no one chart that will signal when the stock-market bottom is in. But technical analyst Chris Kimble argued Friday that an important tell could be offered by a commodity index that is testing a support level that has held for the past 40 years.

In a Friday blog post, the founder of Kimble Charting Solutions pointed to the chart above for the Thomson Reuters Equally Weighted Commodities Index, which he said “will go miles and miles towards telling us if we are headed towards very tough times or if the huge declines of late are actually in a bottoming process.” The chart tracks the index on a monthly basis back to 1954.
Read:The soaring U.S. unemployment rate could approach Great Depression-era levels
The index tracks a basket of 17 commodities, including cocoa, coffee, copper, corn, soybeans, cotton, crude oil, gold, heating oil, lean hogs, live cattle, natural gas, platinum, silver, soybean oil, sugar and wheat.
The index has been headed south over the last nine years, reflecting general weakness in commodities, Kimble noted. In 2009, a then-29-year-old support level held, indicating that the worst of the financial crisis was priced in. It’s testing that level again now.
“If the index holds at 2009 support, it would suggest that lows are in play and the worst has already been priced into the markets,” he said. “If the index breaks this 40-year support/resistance line, it would suggest that some really tough times are ahead!”
Few investors have ruled out a retest of the stock market’s March 23 lows, but bulls contend that despite what promises to be a tide of negative news on public health and the economy in coming weeks, investors are primed for a quick economic rebound once the outbreak is contained, limiting further downside. Bears contend that the sheer uncertainty around the pandemic make it unlikely a deeper selloff can be averted.
Stocks were lower Friday after data showed the U.S. economy shed 701,000 jobs in March — a shocking figure that economists said still underestimated the scale of job losses as a result of the COVID-19 pandemic.
Economic Report:The U.S. officially lost 701,000 jobs in March, but in reality millions vanished
The Dow Jones Industrial Average DJIA, -1.68% closed Friday with a loss of 360.91 points, or 1.7%, while the S&P 500 SPX, -1.51% fell 1.5%.
Major indexes tumbled from record highs in February into a bear market at breakneck speed as the scope of the economic impact from efforts to contain the pandemic became apparent. Stocks bounced back partially last week as the Federal Reserve and other central banks ramped up stimulus efforts and U.S. lawmakers and the White House agreed on a $2 trillion stimulus package.


Add Comment