


Crude-oil prices rallied early Monday to levels not seen in at least seven months as geopolitical tensions continued to boil over following last week’s killing of Iranian general Qassem Soleimani at the hands of a U.S. drone strike.
And the recent pop puts oil at a “critical juncture” that could have big consequences for investors, according to technical analyst Chris Kimble.
“Oil prices are back at a familiar resistance level, a price area that has been tested on two other occasions (aligning with other Middle-East attacks),” he wrote in a blog post on Monday referring to this chart:
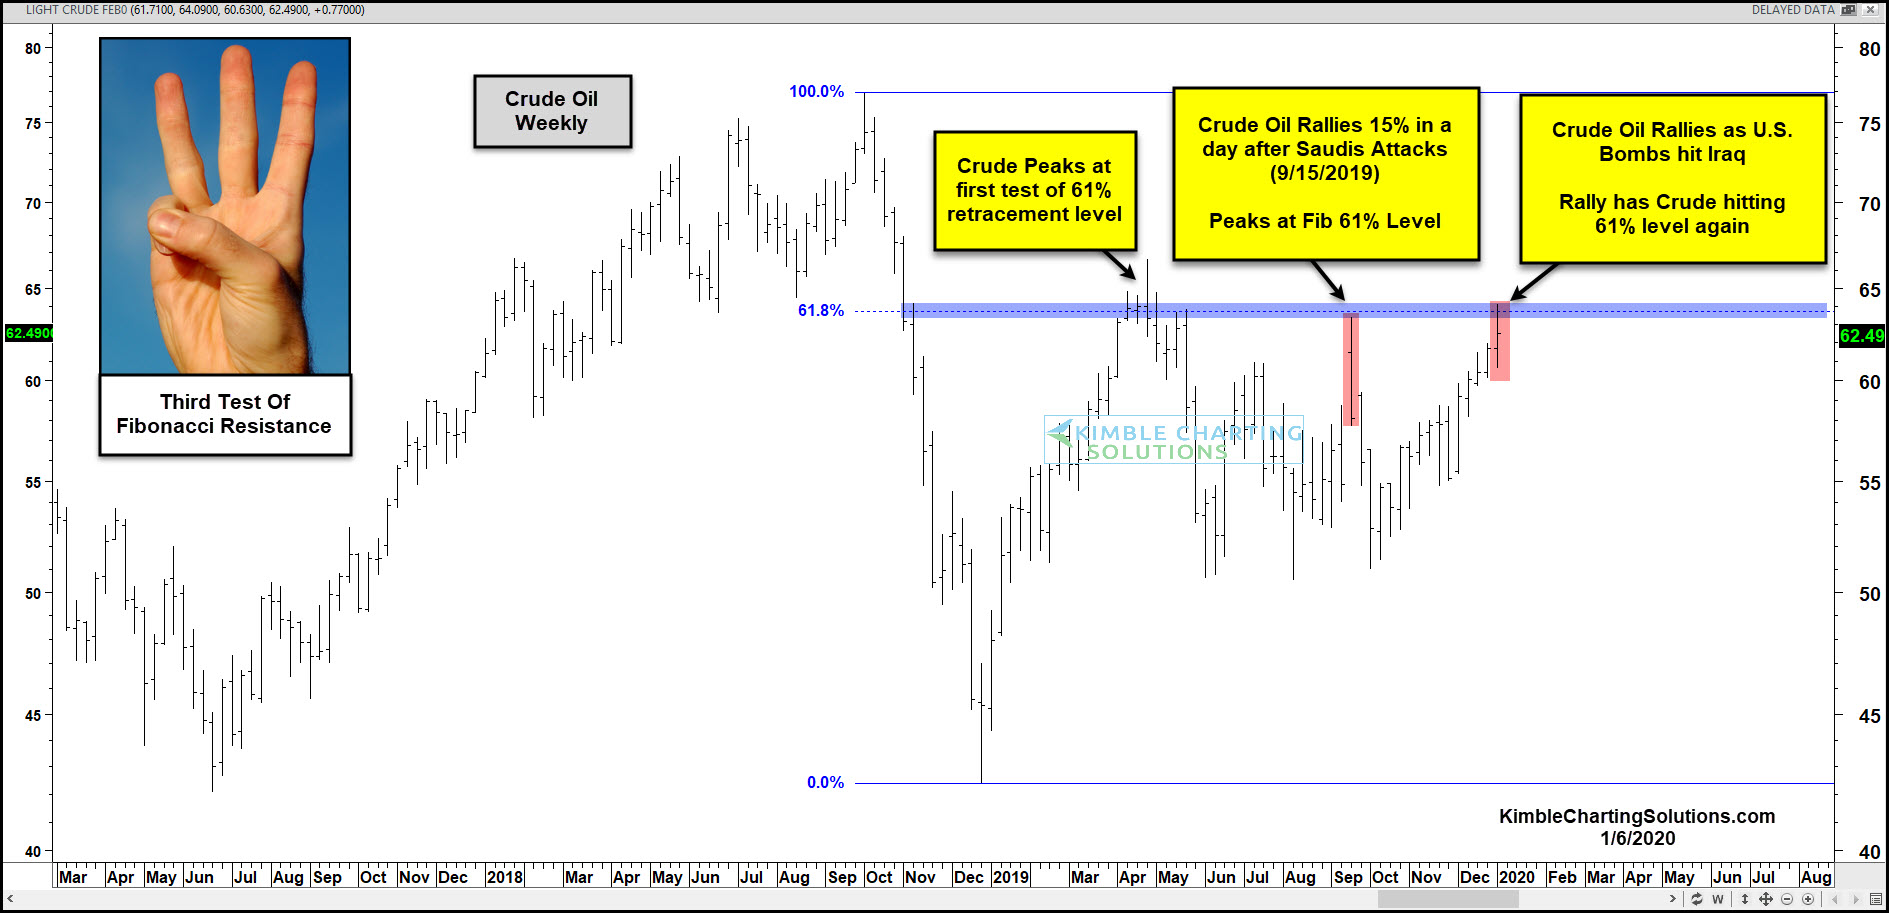
“What crude oil does at this important Fibonacci extension level, could well send an important signal about the conflict or lack thereof with Iran,” he added, pointing out that stocks and crude both hit lows in December 2018 and rallied together from there.
Followers of the Fibonacci ratio of 0.618, also known as the “golden” or “divine” ratio, believe a retracement that surpasses 61.8% of the previous downtrend suggests the rally is no longer a function of the previous trend; basically, a new trend has begun. Click here for more on Fibonacci.
In this case, if oil breaks through resistance, the stock market could follow suit with more highs, Kimble says. But if not, the sellers might have the upper hand.
At last check, stocks were rebounding off Monday’s lows, with the Dow Jones Industrial Average DJIA, -0.21% and the S&P 500 SPX, -0.05% still in the red as the Nasdaq Composite COMP, +0.10% broke into positive territory.


