


Sharp losses on the final trading day of May on Friday appeared set to ensure the S&P 500 will suffer a black eye on the monthly chart, leaving the benchmark index on track to log a “bearish key reversal.”
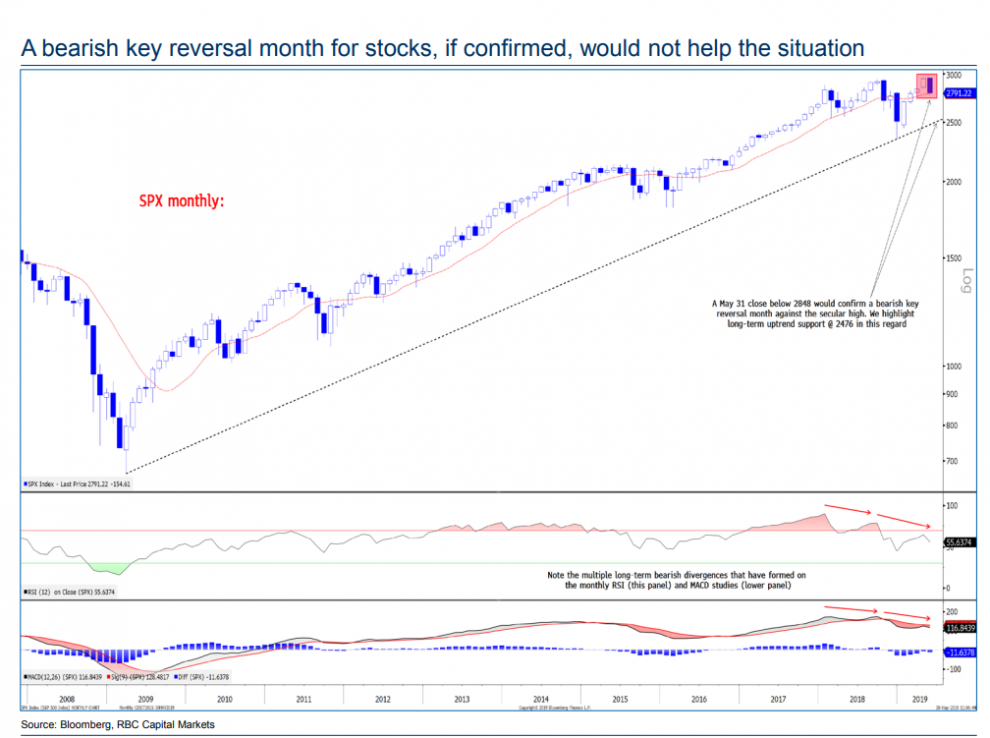
That’s illustrated in the candlestick chart below, from a Thursday note by George Davis, chief technical strategist at RBC Capital Markets:
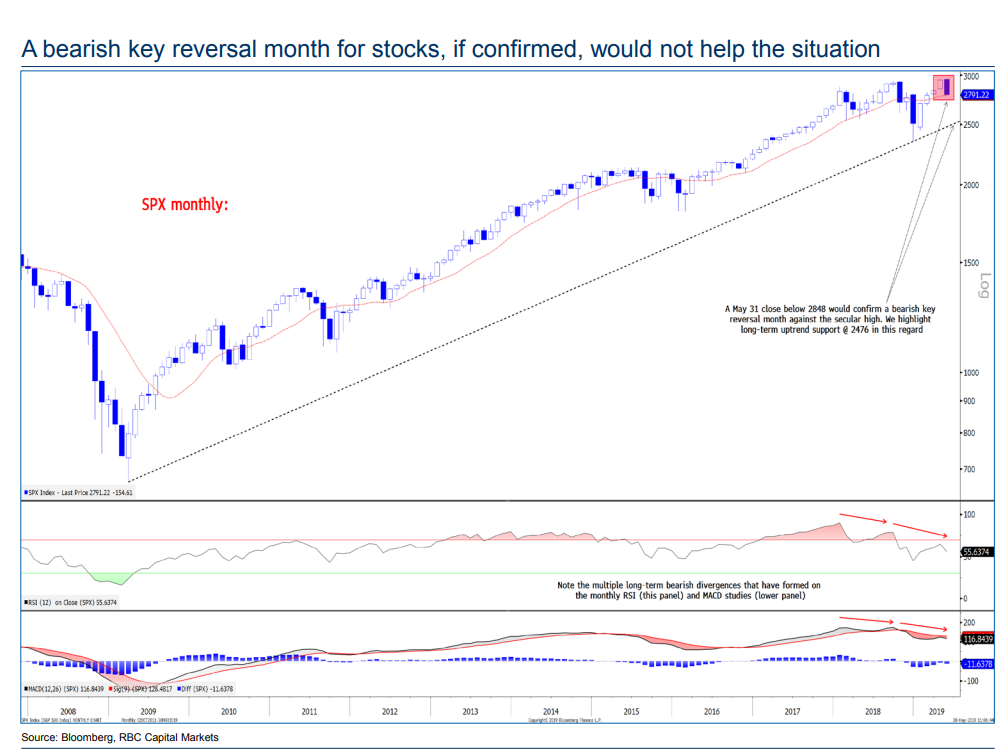
Key reversals are chart patterns that mark trend changes at extremes. A bearish pattern, which sees stocks close at a high in one period, extend that rise in the following period but then retreat to close below the previous period’s low.
Read: 7 key candlestick reversal patterns
To prevent the pattern, the S&P 500 SPX, -0.73% must close above the April low of 2,848 on Friday. That would require a monumental intraday reversal of its own, with stocks down sharply Friday following President Donald Trump’s threat to put escalating tariffs on all Mexican imports — a move that heightened worries over the outlook for economic growth and rattled global financial markets.
Need to Know: Stocks to fall 15% to December meltdown levels, this chart predicts
The S&P 500 was off its session low but still down 0.9% Friday at 2,762.63, while the Dow Jones Industrial Average DJIA, -0.76% was off 250 points, or 1%. The S&P was on track for a 6.2% loss, while the Dow was down 6.3%. That would be the first monthly loss of 2019 and the steepest May decline for both gauges since 2010. The monthly fall, however, remains smaller than the more-than-9% decline suffered by the S&P 500 in December.
Read: Trump moves to slap tariffs on all imports from Mexico, rattling global markets
The likely monthly reversal “presages deeper price declines” and warrants the “maintenance of a defensive posture,” Davis wrote. In the chart, Davis highlights long-term uptrend support at 2,476.
May began on an ominous note, Davis recalled, with the S&P 500 posting a bearish key reversal on the daily chart in the session after notching an all-time closing high. That downturn led to increased risk aversion levels across asset classes, he said.
This week’s break below 2,801, meanwhile, completed what technicians call a head-and-shoulders topping pattern — a formation of three peaks, with the highest in the middle — that Davis said opens up the index to downside targets at 2,722 and then 2,682, with a measured objective that could take it to around 2,651.


