


All of the major stock-market averages — the S&P 500 SPX, -0.22%, the Dow Jones Industrial Average DJIA, -0.22%, the Nasdaq-100 NDX, +0.04% and the Russell 2000 RUT, -1.85% — traded at new all-time intraday highs on Monday and all but the Russell 2000 closed at a new all-time high as well.
In addition, we are in a period of bullish seasonality: the “Santa Claus rally” encompasses the last five trading days of this year and the first two of the next year. With that kind of momentum, we don’t want to fight it. The trend of the charts is still higher.
However, there is some weakening in the indicators, so we want to pay attention to that as well. First, the Santa Claus seasonal period — as defined by Yale Hirsch years ago — is normally bullish for the market. However, if it should turn out that the market declines over that seven-trading-day period, then usually January is a bad month.
The last times that the Santa Claus period ended with a decline were in early January of 2016, 2015, 2008, 2005, and 2000. All led to sharp declines in January, and two of them — 2000 and 2008 — were the beginning of severe bear markets.
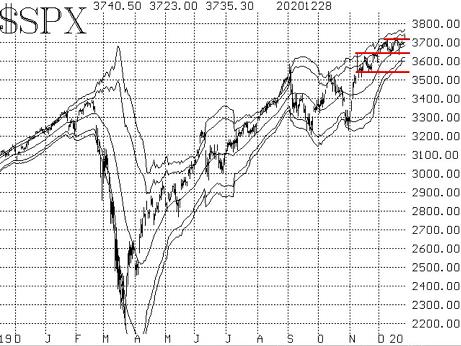
For now, though, the S&P is moving higher. There is tentative support at the prior December highs around 3,720, and then there is strong support in the 3,630–3,650 area. That area has been a daily low for seven trading days so far this month. Hence, it is important support, for every time it is tested and holds, more and more people will rely upon it. If it is broken, there will probably be instant selling.
However, we are still viewing 3,550 as the more important support area, for if that were broken, then the S&P chart would take on a bearish aura.
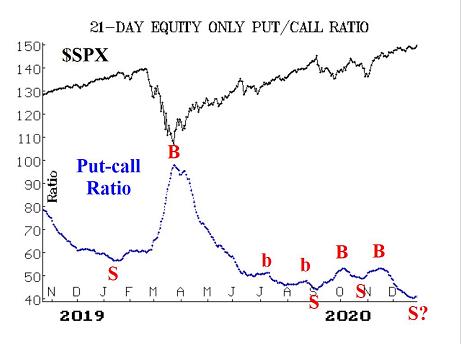
Equity-only put-call ratios have begun to turn upward, and that is a sell signal. However, it is coming from such a low (overbought) position on the put-call ratio chart that it could merely be a reversion to the mean sort of move and not a strong sell signal — yet. It certainly will eventually be a strong sell signal, but we would want to see some confirmation via a price breakdown in the S&P before acting on this potential sell signal. There are so many analysts who seem to be aware of this overbought condition in the put-call ratios (just read an issue of Barron’s) that one thinks the massive call buying might continue for longer than expected — just to confound those who are already shorting the market based on this extreme amount of call buying. We will wait for confirmation.
Market breadth has begun to slip. This was the strongest indicator for the market’s most recent rise since the election. However, on Dec. 22, the breadth oscillators rolled over to sell signals. Those were quickly stopped out by an improvement in breadth on Dec. 23, but the warning shot has been fired.
These breadth oscillators have been very reliable indicators over the past few months, so — even at the risk of some whipsaw losses — we will be following their lead.
In “stocks only” terms, Cumulative breadth and cumulative volume breadth (CVB) have not made new all-time highs since Dec. 17, but that is too short of a time for them to be considered negatively divergent — yet.
New highs continue to dominate new lows in a spectacular fashion. This indicator remains bullish.
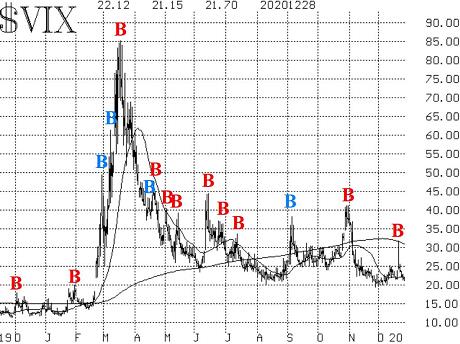
Volatility, while remaining high, has recently issued a new buy signal. On Dec, 21, S&P futures fell about 70 points in overnight trading on news that the coronavirus had developed a new strain, and the U.K. was imposing new restrictions. VIX VIX, +6.36% spiked up nearly 10 points on that news — a seeming overreaction. As the day wore on, stock prices recovered and VIX began to fall. By the end of that day, VIX had generated a new “spike peak” buy signal.
That buy signal will remain in place for 22 trading days (until late January) or unless it is stopped out by VIX once again entering “spiking mode.” Coincidentally, the nearly 10-point rally in VIX on Dec. 21 took it almost exactly to its now-declining 200-day moving average.
Historical volatility has continued to drop, even while implied volatility has not. The S&P’s 20-day historical volatility is now down to 9%. A move below 8% would be an extreme overbought condition and would be the precursor to another sell signal.
The construct of volatility derivatives has remained bullish, too. The front end of the VIX futures term structure remains bullish in that January VIX futures (now the front month) are trading at lower prices than the February VIX futures. If that should invert, it would be an immediate sell signal.
In summary, the market seems to be setting up in a very similar fashion to year-end 2017 and year-end 2019. The euphoria of those periods eventually unleashed a nasty market decline in the following February.
It appears that the market can’t help itself and is likely headed for a similar result.
However, the momentum is still strong to the upside, so remain long and tighten stops, while rolling calls up to higher strikes if appropriate. Eventually, it will be time to short this market, but it’s too soon to do so right now. So we remain bullish, but will certainly trade sell signals when and if they occur.


