


Don’t fall into the trap of believing the U.S. stock market’s spectacular return over the past two years represents the new normal. Not only will the market’s return in coming months likely be a lot lower than it was over the past two years, the odds are good that its return will be well-below average. Barely positive, in fact.
I base this prediction not on the stock market’s overvaluation, the current high inflation rate, how the Russian-Ukrainian conflict will be resolved — or any of the other topics dominating financial news these days. I base it instead on the historical tendency for the market to be a below-average performer following two-year periods in which it performed as spectacularly as it has since the March 2020 bottom.
Let there be no doubt that U.S. stocks’ performance over the last two years has been nothing short of spectacular. The S&P 500 SPX, -0.03% more than doubled over the two years from its March 2020 low, its best rolling two-year return since 1937.
The chart below shows the stock market’s tendency to cool after red-hot two-year periods, and to heat up after terrible ones. I based the chart on my analysis of the Dow Jones Industrial Average DJIA, +0.01% back to its creation in 1896, which is further back than daily data for the S&P 500 extend.
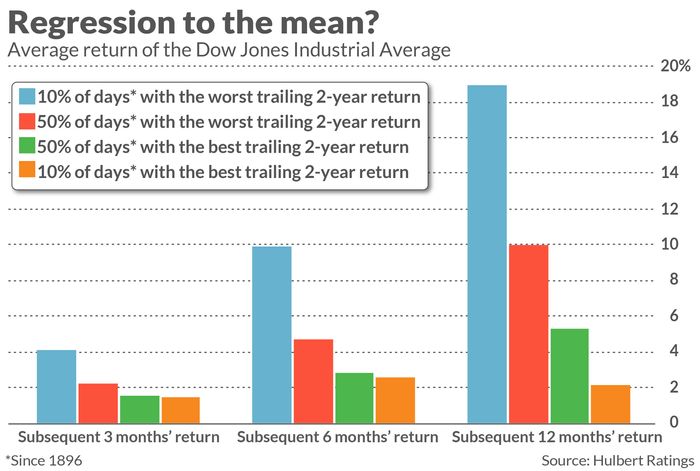
Note that the tendency plotted in this chart goes beyond mere regression to the mean. That would be the case if the stock market’s average return after a red-hot period was no different than after a terrible one.
In fact, as you can see in the chart, the stock market’s average return after particularly good two-year stretches is significantly lower than after particularly poor two-year periods. This difference is significant at the 95% confidence level that statisticians often use when determining if a pattern is genuine.
Recency bias
If you’re like most investors, your reaction to market strength over the past two years has been to become more bullish, not less. This is an example of what behavioral economists call “extrapolation bias” or “recency bias” — the tendency to assume that recent trends will persist.
The chart below illustrates the extent to which the average investor is guilty of these biases. The chart is based on data from Natixis’s annual “Survey of Individual Investors.” Each year, one of the questions the firm poses to respondents is: “What are the real annual returns (above inflation) you expect to achieve in the long term?” On average since 2014, their answers have grown in synch with the stock market’s trailing returns.
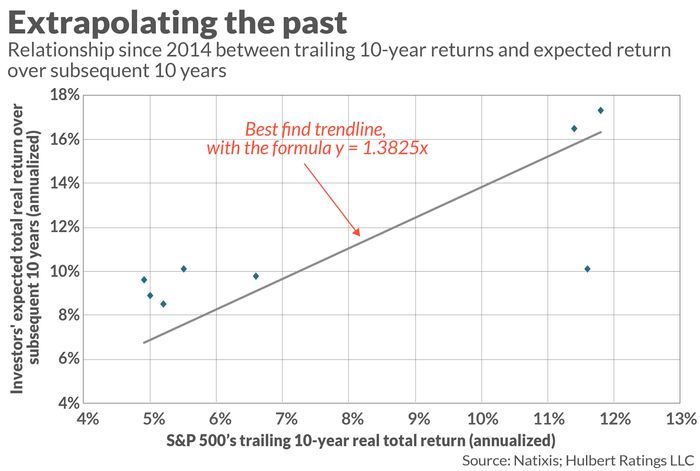
Over the past two years, for example, investors’ expectation of their future post-inflation return have grown to 17.3% annualized from 10.1%. This latest expectation is almost triple the market average since 1793. There are few things about which we can be certain in the stock market, but I am quite certain that the average investor will come nowhere close over the next decade to achieving this return.
Mark Hulbert is a regular contributor to MarketWatch. His Hulbert Ratings tracks investment newsletters that pay a flat fee to be audited. He can be reached at [email protected]
More: The S&P 500 chart is still bearish despite the stock market’s recent gains


