


The U.S. stock market is overvalued now, period.
That would be worth keeping in mind at any time, of course, but especially now with the major market averages significantly off their late-April peaks. If current valuations were reasonable, then we could count on them to provide a safety net below this market.
Unfortunately we can’t. Yet many stock-market bulls contend that such a safety net does exist. Some are arguing that the stock market correction in late 2018 worked off many previous valuation excesses. One adviser I monitor contended that “valuation metrics [in late April] for the S&P SPX, -0.28% [were] much lower than where they were last year.”
I disagree. Though valuations did improve between the market’s late-September and late-April peaks, the improvement was so slight as to barely improve equities’ outlook. Consider perhaps the most popular valuation measure: The price/earnings ratio. At the S&P 500’s late-September peak, the P/E ratio based on trailing 12 months as-reported earnings stood at 22.5. At its late-April peak, in contrast, it stood at 21.9 — less than 3% lower.
Read: Morgan Stanley tells investors to play defense as cycle indicator flashes ‘downturn’
To understand how modest a decline that is, consider a simple econometric model that uses the P/E ratio to predict the S&P 500’s inflation-adjusted total return over the subsequent 12 months. I constructed this model using data back to 1871 from Yale University finance professor (and Nobel laureate) Robert Shiller. The reduction in P/E from September to April translates into an increased forecasted return of just 6 basis points.
Good luck with that. The message of other valuation measures is similar. Consider five on which I also focused for this column: The cyclically-adjusted P/E ratio (or CAPE), made famous by Yale’s Shiller; the price-to-book and price-to-sales ratios; the dividend yield, and the Q-Ratio (calculated by dividing market value by the replacement cost of assets). The accompanying chart shows the percentage of past bull market peaks that had lower valuations than what prevailed at the market’s late-April high.
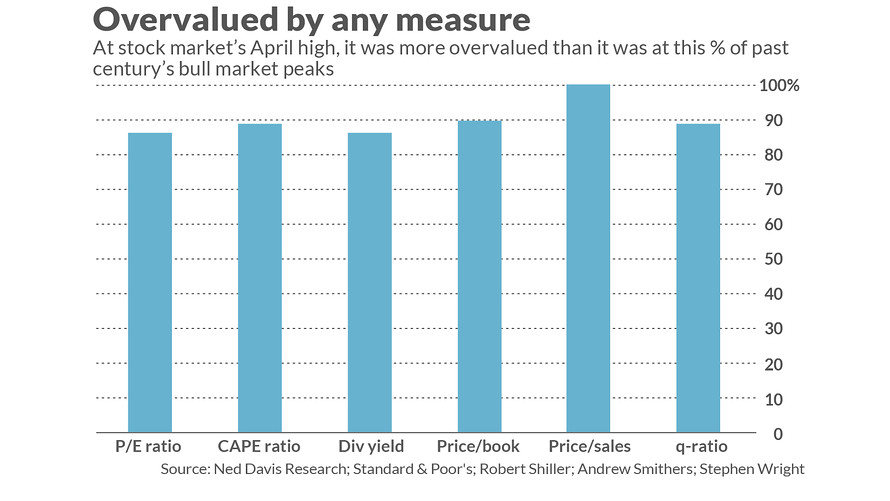
Notice that the market at that high was more overvalued than it was at anywhere between 86% and 100% of past bull market peaks (depending on which valuation measure used). The overwhelming message: Don’t look to valuations to cushion any decline.
This doesn’t mean that a bear market began at its late-April peak, of course. The stock market has been overvalued for a number of years now and, for the most part, has continued to produce impressive returns. What the valuation measures do mean is this: You’re on shaky ground if you have been giving the bull market the benefit of the doubt because of its allegedly reasonably valuation. You either need to find some other reason to be bullish, or to reduce your bullishness.
Mark Hulbert is a regular contributor to MarketWatch. His Hulbert Ratings tracks investment newsletters that pay a flat fee to be audited. He can be reached at [email protected]
More: Feds target four of the biggest tech companies in U.S., and their stocks are getting slammed
Related: One of the market’s great technical stock analysts folds up his newsletter charts


