


Oil’s big price spike isn’t the bad news that many are assuming it to be.
To be sure, the Dow Jones Industrial Average DJIA, -0.52% responded to this past weekend’s attacks on Saudi oil fields with a triple-digit decline on Monday. But there’s a good chance that, once investors digest the price hike and the doom-and-gloom predictions that it would be a “game changer,” the stock market will resume its uptrend.
That’s because many investors are interpreting recent events through the lens of years ago, when a higher oil price was indeed a bearish omen for the equity markets. But over the last decade, the relationship between oil CLV19, -0.94% and the stock market has been just the reverse.
This shift is clear in the accompanying chart, which plots the correlation coefficient for the trailing 60-month relationship between stocks and crude oil. If the two rose and fell in perfect lockstep, of course, that coefficient would be plus 1.0 — and minus 1.0 if stocks always rose when oil fell, and vice versa. A coefficient of zero would mean there is no detectable relationship one way or the other.
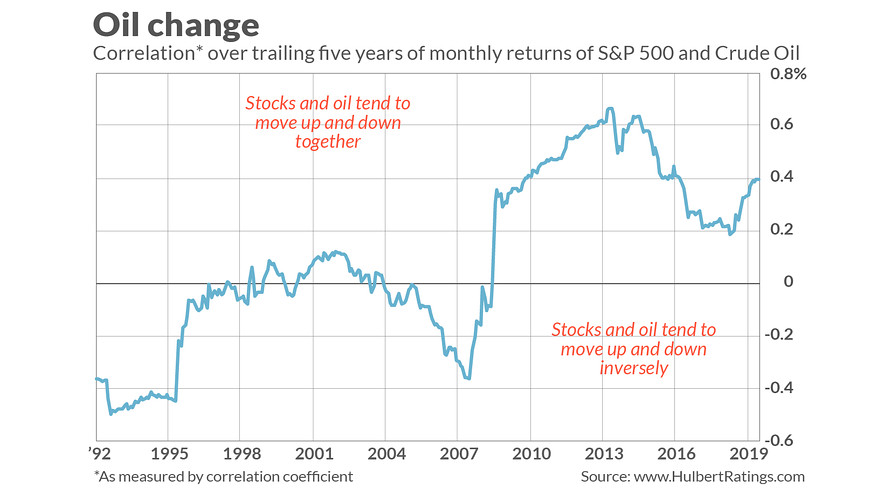
Notice that, prior to the Great Financial Crisis a decade ago, the oil-stock correlation coefficient was predominantly negative. Since then, however, the correlation has been positive, and sometimes very much so.
I am not the first person to note this shifting correlation, of course. Three years ago, in fact, former Federal Reserve chairman Ben Bernanke devoted a blog post to the subject.
New research, in the current issue of Investment Analysts Journal, provides insight into why stocks and oil are positive correlated at some times and negatively correlated at others. The authors — An-Sing Chen and Che-Ming Yang, both of the Department of Finance at Taiwan’s National Chung Cheng University — find that there is a threshold oil price below which stocks and oil are positive correlated, and above which it is just the reverse.
The period the researchers analyzed ended in 2016, and they don’t indicate what oil’s threshold price would be today. I note, however, that over the last decade in which the oil-stock correlation has been positive, oil’s average price has been above $70 per barrel. That’s still higher than the price at which oil CL.1, -0.94% is now trading.
We can only speculate as to why the stock market responds differently when oil’s price is above or below this threshold. One plausible theory is that the U.S. has become more energy self-sufficient. According to the Energy Information Administration, for example, the amount of oil and petroleum products the U.S. has imported, relative to the amount it has exported, has been declining steadily for many years. In some months, in fact, U.S. has been a net exporter of petroleum products.
To the extent the U.S. is a net exporter today, of course, then by definition a higher oil price will be a net positive for the U.S. economy as a whole. And insofar as imports and exports of petroleum products are in a rough balance, then there should be little net economic effect of a higher oil price.
The bottom line? Don’t automatically assume that oil’s price hike spells the end of the economic expansion or the bull market. It might actually keep both the economy and the bull running strong.
Mark Hulbert is a regular contributor to MarketWatch. His Hulbert Ratings tracks investment newsletters that pay a flat fee to be audited. He can be reached at [email protected]
More: Why Saudi Arabia’s output hit won’t lead to shocking prices at the gas pump


