


The Federal Reserve, as was widely expected, cut benchmark borrowing costs for the first time in more than a decade Wednesday afternoon — but the cut appears unlikely to improve Jerome Powell’s less-than-stellar stock-market record?
The 66-year-old Fed boss has a losing record on Wall Street as it pertains to the market’s reaction to Fed’s statements and his words. He has had two winning days out of the past 11 meetings, with the only positive gains for the market coming in January when policy makers paused a string of rate increases, MarketWatch’s William Watts has noted, and last month when Powell & Co. set the stage for Wednesday’s move.
Live blog: Fed decision and Jerome Powell press conference
The Dow Jones Industrial Average DJIA, -0.88% fell more than 300 points at its low ans was off nearly 270 points, or 1%, in recent action, while the S&P 500 SPX, -0.71% was off 0.8% after Powell said the Wednesday move wasn’t the beginning of a lengthy cycle of rate cuts and described the move as a “midcycle” adjustment. The lack of urgency appeared to disappoint investors looking for a more sustained drop.
Near-term reaction aside, how does the market tend to perform in a rate-cut regime?
First the good news: Markets, as would be expected, tend to rally after rate cuts, because those policy actions translate into lower borrowing costs for individuals and corporations and tend to support higher moves for stocks.
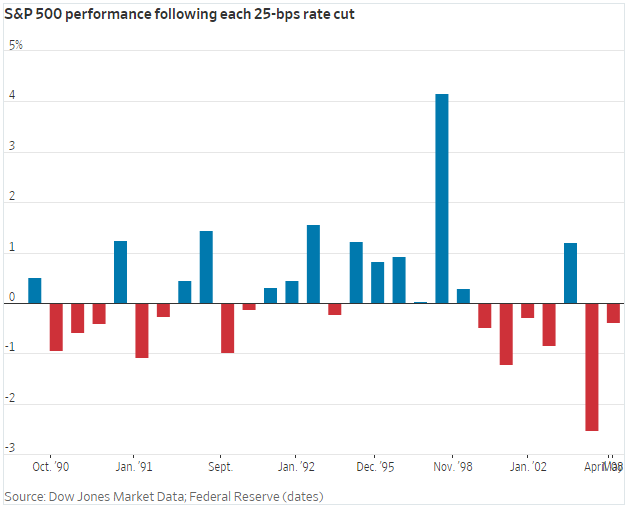
In fact, since 1990, the S&P 500 has gained on average 0.16% on the day of a 25-basis-point cut. One-month later, the broad-market benchmark is 0.57% higher. Double that cut and the market is 0.34% higher on the of the decision day and 1.25% higher a month later. A 75-basis-point reduction has resulted in a powerful 2.76% rally on average but 0.27% gain in the following 30-day period.
That brings us to the bad news (and partly good news), the greater the magnitude of the rate cut, the weaker the returns over the coming three and six months. However, a quarter-of-percentage point has tended to be a Goldilocks number, resulting in an average return of 3.67% three months later and 5.64% in six months.
Cuts of 50-basis points and greater all resulted in losses in the coming quarter and half-year period, as the following table shows:
| Rate cuts | Day of | One month later | 3 months later | 6 months later |
| 25-basis-point cut | 0.16% | 0.57% | 3.67% | 5.64% |
| 50-basis-point cut | 0.34% | 1.25% | -1.36% | -3.58% |
| 75-basis-point cut | 2.76% | 0.27% | -3.97% | -4.01% |
Part of that may be that sizable cuts also have coincided with economies that were in need of help. This rate cut is one that is being billed as a so-called insurance cut, with the Fed hoping to mitigate the harm of a longstanding trade dispute between China and the U.S. that Powell has described as creating “cross-currents” in markets and the economy.
The fact that a more modest cut has had a more lasting impact on markets may be worth noting, given the degree to which investors, including President Donald Trump, have been clamoring for sizable monetary-easing measures.
Check out: Goldman raises its 2019 target for S&P 500, projects another 10% rise in 2020
—Ken Jimenez contributed to this article


