


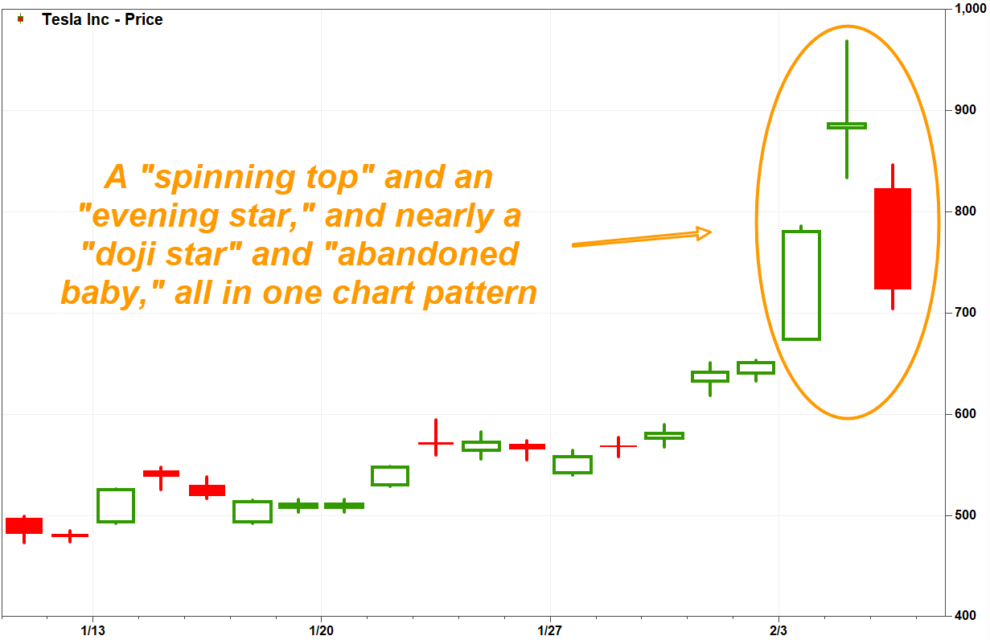
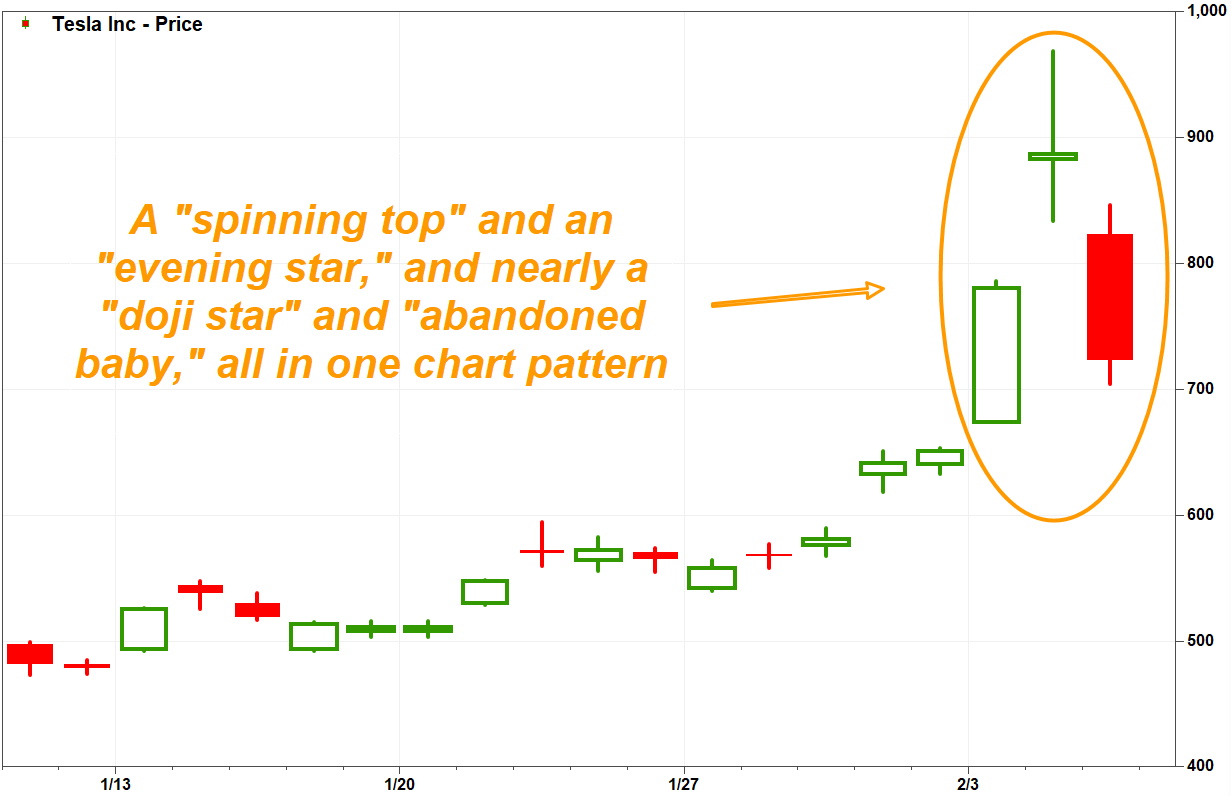
Tesla Inc.’s stock TSLA, -17.18% is selling off hard on Wednesday, but the real drama occurred during the previous session’s rally, when a short-term “spinning top” appeared as part of an “evening star” reversal pattern to warn that the dramatic rally may have finally succumbed to gravity.
The evening star is technically a three-day candlestick chart pattern that starts with a long white candle, which depicts a day in which the closing price is well above the opening price. Next is a small candle — the spinning top — followed by a longer black candle, in which the close is well below the open.
Think of, when you throw a ball up in the air, the spinning top is where the ball stops in midair just before falling back down.
The pattern can send a stronger message of a reversal in progress if the middle small candle (or body) is much smaller than the first and third candles, and is in the middle of the day’s range.
That sounds exactly like what appeared in Tesla’s stock chart this week:
 FactSet, MarketWatch
 After running up 19.9% on Monday, the stock traded in a wide range of up 6.9% to up 24.2% before settling on Tuesday up 13.7%, which was the “first sign that there was confusion in the market,” said candlestick charting guru Steve Nison.
On Wednesday, the stock tumbled 17.2% to $734.70, just above the middle of Monday’s body.
Don’t miss: Tesla ‘off the accelerator’ as stock takes worst stumble in more than 6 years
Also see: Famed short seller tells MarketWatch why he’s betting against Tesla’s ‘casino’
As described by Nison, who is founder of Candlecharts.com, an evening star suggests that after a strong push higher by bulls (the first tall body) to a new high, there is a battle between bulls and bears that ends in a virtual stalemate (small second body), which shouldn’t necessary happen after such a big victory by bulls. (Read more about Steve Nison and candlestick charts.)
And the longer the spinning top’s shadows — the lines that extend above and below the bodies to the respective intraday highs and lows — the more epic the battle, so the more devastating for the eventual loser.
The third candle confirms that the pattern is a reversal, as it declares the bears the winner of the spinning top’s battle. The deeper the third candle cuts into the first candle’s body, the more pronounced the confirmation.
“Maybe not enough to get out of the market, but maybe lighten up,” Nison said.
Also read: 7 key candlestick reversal patterns
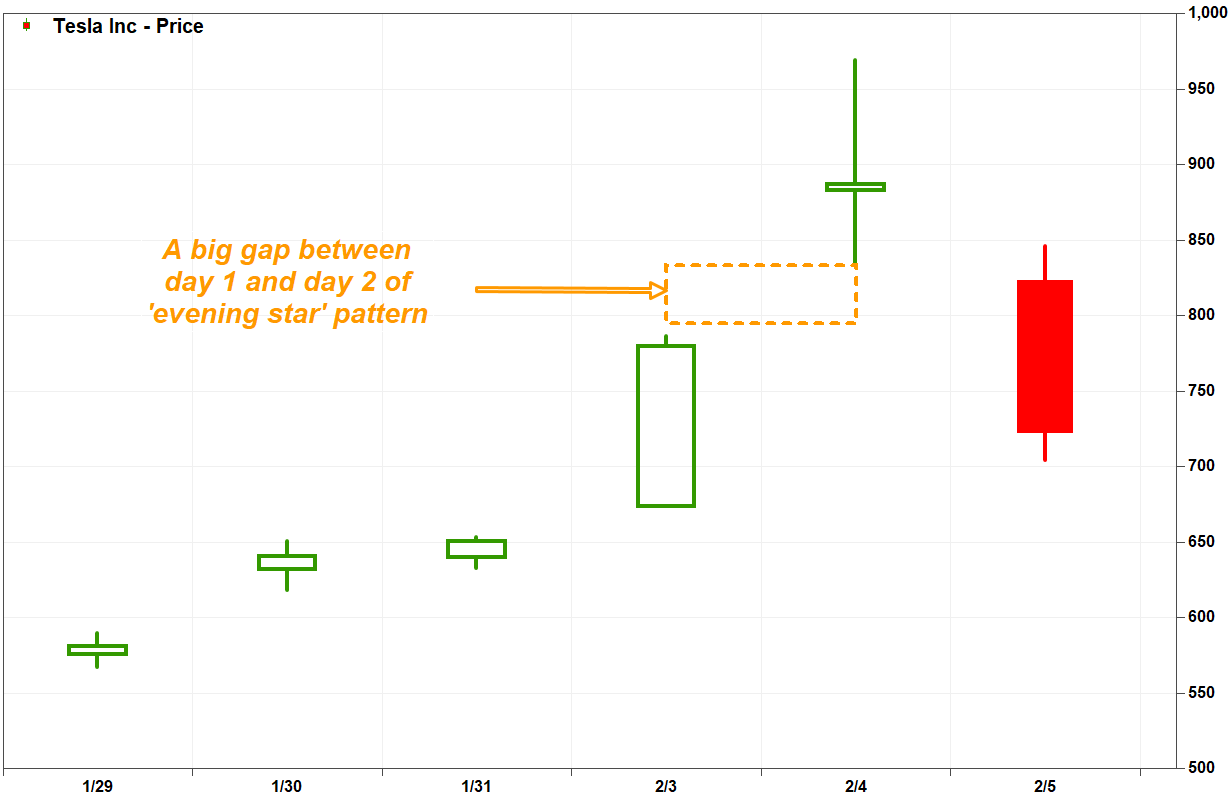
Nison said in “Japanese Candlestick Charting Techniques” that, in principle, there should be a gap between the first two bodies of the evening star, which the uncharted space between the first and second day’s shadows.
Check. The intraday low of Tesla’s stock on Tuesday was $833.88, well above Monday’s high of $786.14.
 FactSet, MarketWatch
 Nison said potential support levels include the “window,” another word for price gap, between Monday’s intraday low of $673.52 and the the Jan. 31 high of $653.00, followed by the even larger window between the Jan. 30 low of $618.00 and the Jan. 29 high of $589.80.
“Candlesticks don’t give price targets, so we don’t know much of a correction there will be,” Nison said.
Keep in mind that technical charts are just one way to visualize the underlying battle between supply and demand over time. And reversal patterns aren’t meant to be buy or sell signals; they are alarms suggesting it’s time for a risk-reward assessment, as the recent trading behavior resembles the behavior seen during previous trend reversals.
“Calling reversals is a very high risk trade for a [new] investment,” Nison said. “Breakouts are much easier.”
The area around the top of the evening star pattern is the potential resistance area, Nison said.
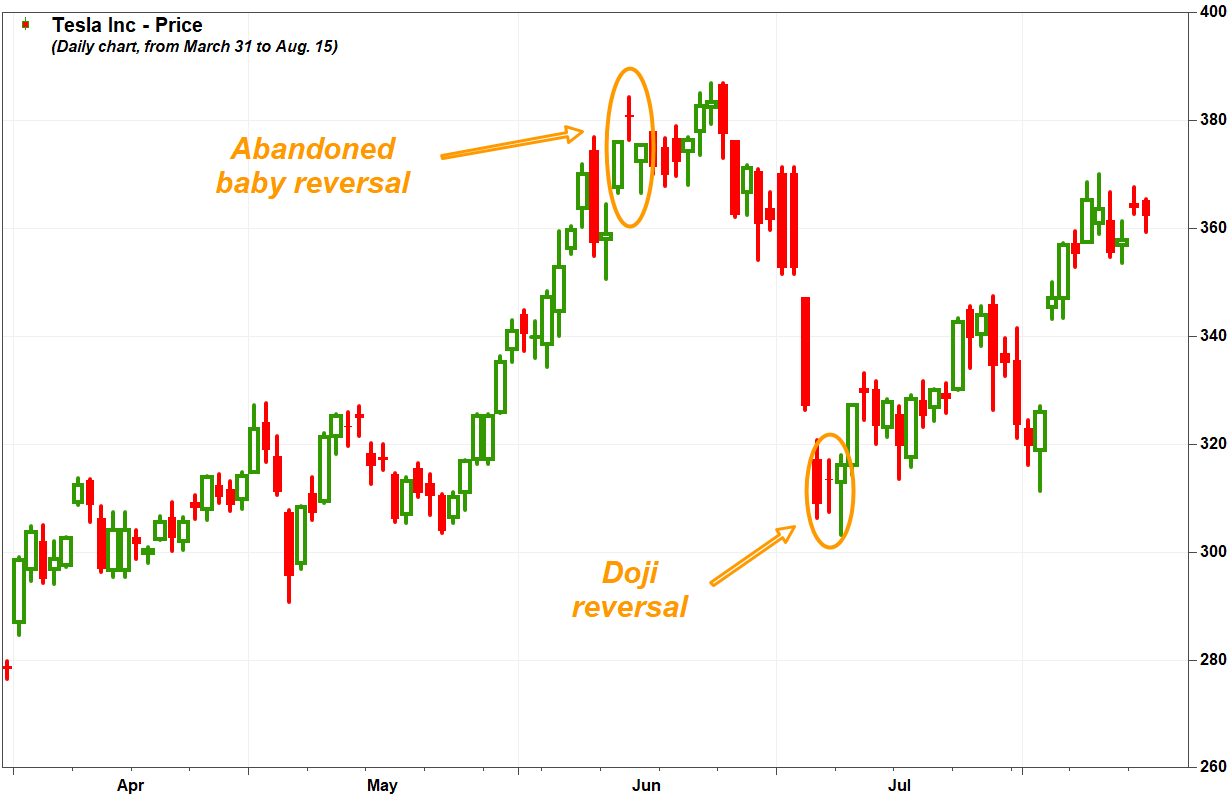
Evening star was nearly an abandoned baby
If there was a gap between the second and third day’s shadows of the evening star, the pattern could be characterized as an abandoned baby. Nison has said those patterns are very rare — and send a much stronger warning of a reversal.
The shadows overlapped, however, as Wednesday’s high of $845.98 was higher than Tuesday’s low of $833.88.
Also, if there was no middle body, because the stock had opened and closed at the same price, it would be referred to as a “doji” (Japanese for “at the same time”) which at extreme levels of a trend is much stronger warning that supply and demand have reached equilibrium.
For example, an abandoned baby appeared on June 14, 2017, after a sizable rally to a record close on June 13. After a three-day pullback, the stock bounced to a new record before a sharp near-two-week selloff that ended in a doji pattern on July 7.
 FactSet, MarketWatch
 Given that Tesla’s latest evening star also appeared in a shorter term a daily chart, rather than in longer-term charts such as weeklies and monthlies, the message is also shorter term in nature.
Tesla’s stock has more than doubled (up 125.0%) over the past three months, while shares of rival automobile maker General Motors Co. GM, +1.92% have lost 8.8% and those of Ford Motor Co. F, -9.48% have shed 6.8%. The S&P 500 index SPX, +1.13% has gained 8.4% over the same time.
div > iframe { width: 100% !important; min-width: 300px; max-width: 800px; } ]]>


