


The most closely watched U.S. equity benchmark indexes have celebrated numerous record closes of late, but the broader stock market has not joined in on the fun.
Measures of market breadth have deteriorated in recent weeks, and analysts say that this dynamic may foretell a significant pullback ahead for the S&P 500 index SPX, +0.41%
Market breadth is a term describing the number of stocks that are gaining or losing ground during a given period, and can provide investors insight into the broader stock market that are hidden by market-capitalization weighted indexes, like the S&P 500, which places greater emphasis on the most highly valued firms.
Thin market breadth can portend weakness in market-cap weighted indexes, as it’s uncommon for a handful of large companies to consistently rise in value while most publicly traded firms are not, analysts say.
“There are some definite warning signs in these indicators,” Mark Newton, president of Newton Advisors told MarketWatch, adding that he has recently changed his medium-term outlook from bullish to neutral and expects a significant pullback in stocks sometime this fall.
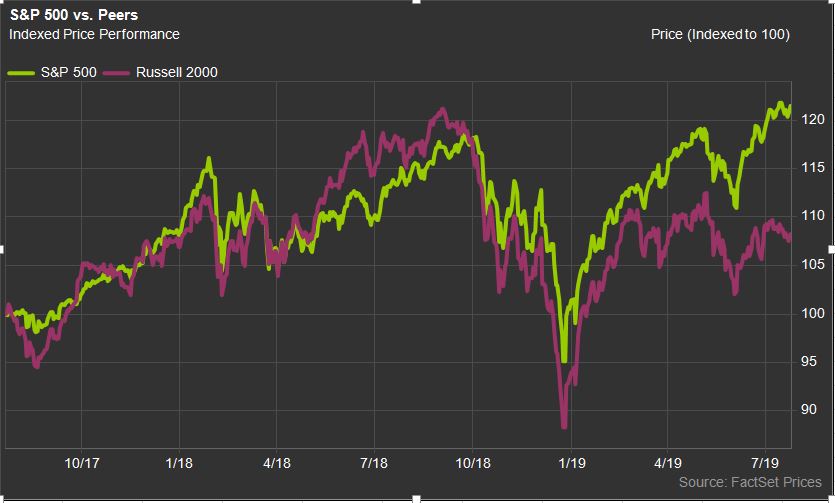
Newton pointed to the relative underperformance of small and mid-cap companies, which have fallen relative to the S&P 500 to the lowest level in 10 years. “While it’s right not to get too bearish on a couple years of small-cap underperformance, the combined deterioration of both small and mid looks important given the rate of change of this decline in the last six to twelve months,” he said.
 FactSet
Craig Johnson, chief market technician at Piper Jaffray, agreed that market internals were flashing warning signs, in a recent note to clients. “Market breadth remains an ongoing concern as evidence suggests there has been a growing divergence between the recent record highs on the SPX and overall participation,” he wrote.
“Over the last several weeks there has been a declining percentage of stocks registering new 52-week highs on the S&P 500, despite its near 10% record-high rally,” he added. “Based on the divergence in breadth accompanied with weak volume and deteriorating momentum, we believe risks for a deeper pullback are growing.”
Johnson sees the S&P 500 SPX, +0.41% ending the year at 2,750, or nearly 9% below its current level.
Newton’s other favorite indicators include the percentage of stocks on the New York Stock Exchange that are trading above their 200-day moving average. This measure shows that “nearly half of all NYSE stocks are now trading below their 200-day moving average, despite indexes being near record highs,” he said.
The ratio of stocks on the NYSE gaining versus those declining has also started to fall. It remains near all-time highs, but it has been retrenching for the past two weeks, and according to Newton, this statistic is worth watching as “many of the recent records occurred with flat or negative breadth.”
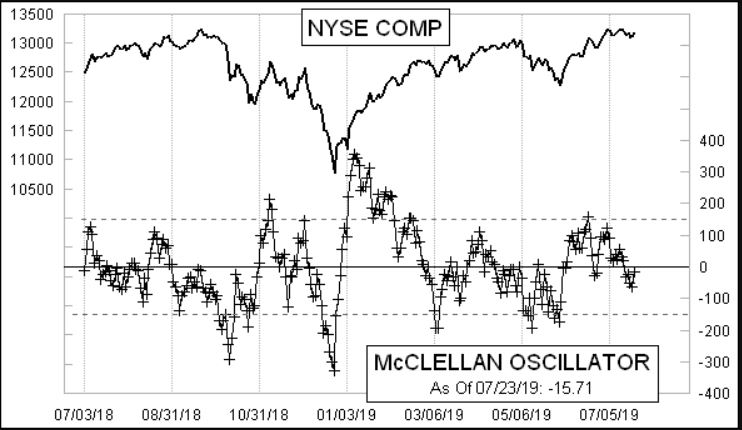
Newton also watches the McClellan Summation Index, a smoothed gauge of market breadth, which peaked in late February and fell into June before rallying again. “Yet it rallied at much lower highs,” he said. “Note that this peaked last August 30th, a full month ahead of the S&P 500 in mid September” before market’s swooned in the fourth quarter of last year, he said, giving credence to the index as a forward indicator of the broad market.
 McClellan Financial Publications


