


The recent pullbacks in megacapitalization technology stocks have now gone far enough and lasted long enough that they have triggered chart signals warning investors that at the very least, don’t buy these stocks on the dip.
The chart signals are being flashed by the widely followed 50-day simple moving average, which many on Wall Street use as a guide to the short- to intermediate-term trend. The most forceful of the warnings apply to three of the four biggest companies by market capitalization, which have helped drive the rally in the broader stock market since the March lows: Microsoft Corp. MSFT, -1.24%, Amazon.com Inc. AMZN, -1.78% and Google’s parent Alphabet Inc. GOOGL, -2.41% GOOG, -2.37%.
Slightly less forceful warnings, but warnings nonetheless, are also flashing for shares of the biggest of the big, Apple Inc. AAPL, -3.17%, as well as the Invesco QQQ exchange-traded fund QQQ, -1.27%, which tracks the technology-heavy Nasdaq-100 index NDX, -1.29%, and the S&P 500 index SPX, -1.11%.
Also read: Megacap tech selloff as the QQQs on track for the biggest monthly drop since the financial crisis
Mark Arbeter, president of technical analysis at Arbeter Investments LLC, said many of the “overloved and overowned” megacap leaders are in “precarious” technical positions.
“For some of the indices and individual names, the 50-day has flattened out, and for others it looks to be rolling over,” Arbeter said. “This as well as their chart patterns and sentiment suggest the intermediate-term outlook has switched to neutral, if not bearish.”
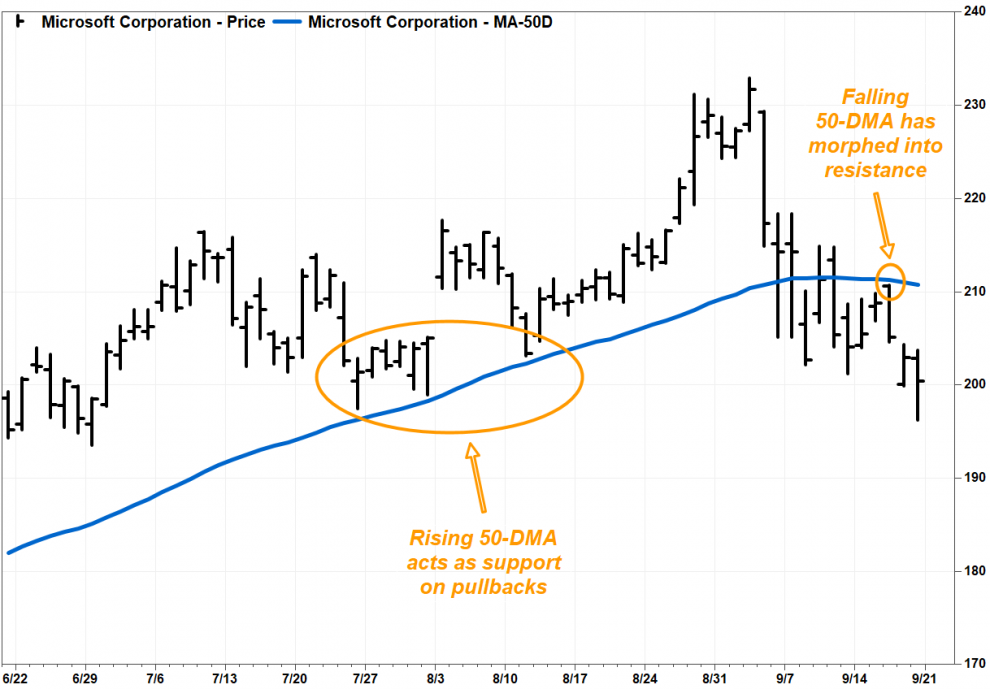
Microsoft’s stock closed lower Friday by 1.2% at $200.39, marking the ninth straight session it which it has closed below its 50-day moving average, or 50-DMA. If that’s not enough to scare away buyers, or enough to embolden bears, the 50-DMA started rolling over on Sept. 11, and has accelerate lower since then.
At Friday’s close, the 50-DMA was at $210.730, or 27.8 cents below Thursday’s closing 50-DMA at $211.008, which was 19.9 cents below Wednesday’s $211.207, according to FactSet data.
On Wednesday, falling 50-DMA even acted as resistance, capping the stock’s attempted rally at the open. That’s a change from late July to mid-August, when a rising 50-DMA acted as support.

As JC O’Hara, chief market technician at MKM Partners, said in a note to clients this week, it’s the slope that matters.
“We acknowledge moving averages are absolute levels to monitor during one’s process,” O’Hara wrote. “In our work, we find it is more important to monitor the slope of the moving average, not necessarily the level of the average.”
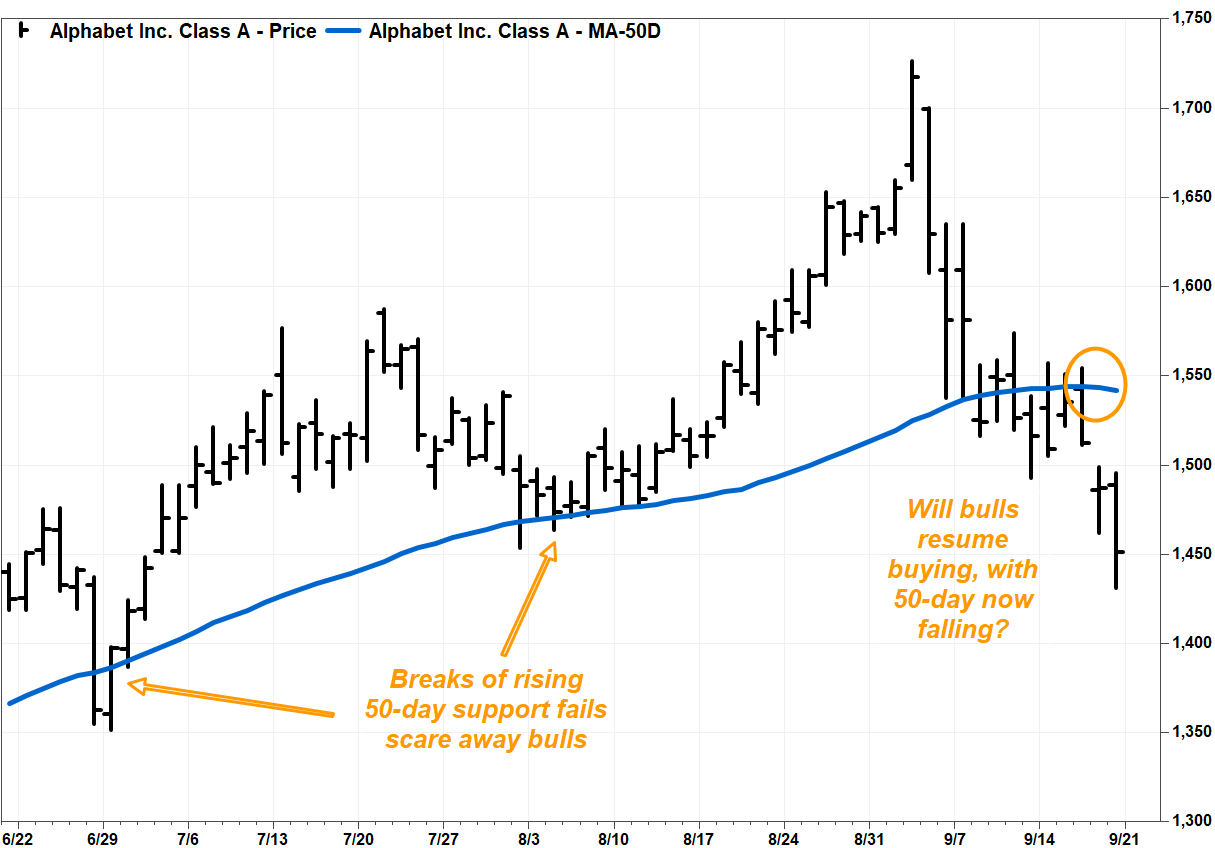
With that in mind, the slopes of the 50-DMAs for shares of both Amazon and Alphabet turned negative on Thursday, and fell further on Friday.
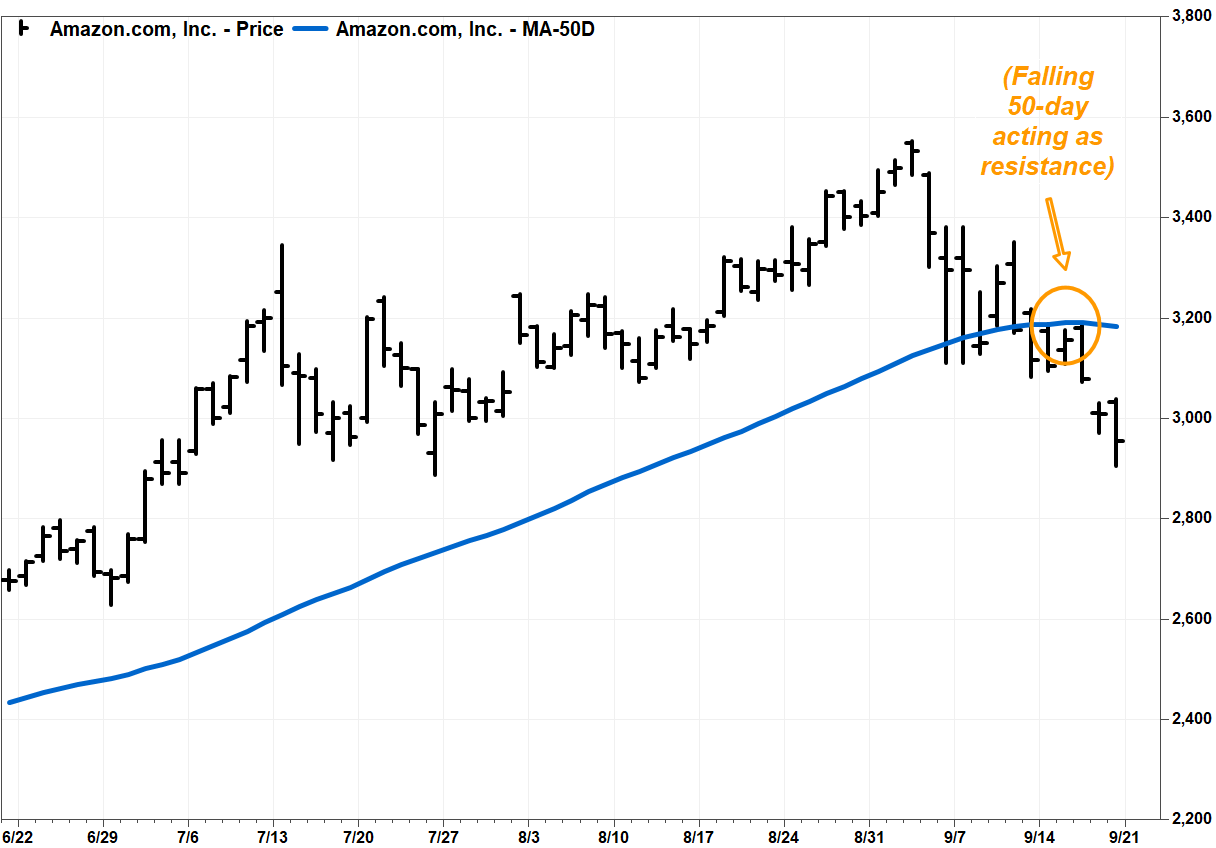
Amazon’s 50-DMA declined by $4.554 on Friday after slipping $1.448 on Thursday, while Alphabet’s 50-DMA eased by $1.351 on Friday after inching 33.1 cents lower on Thursday.
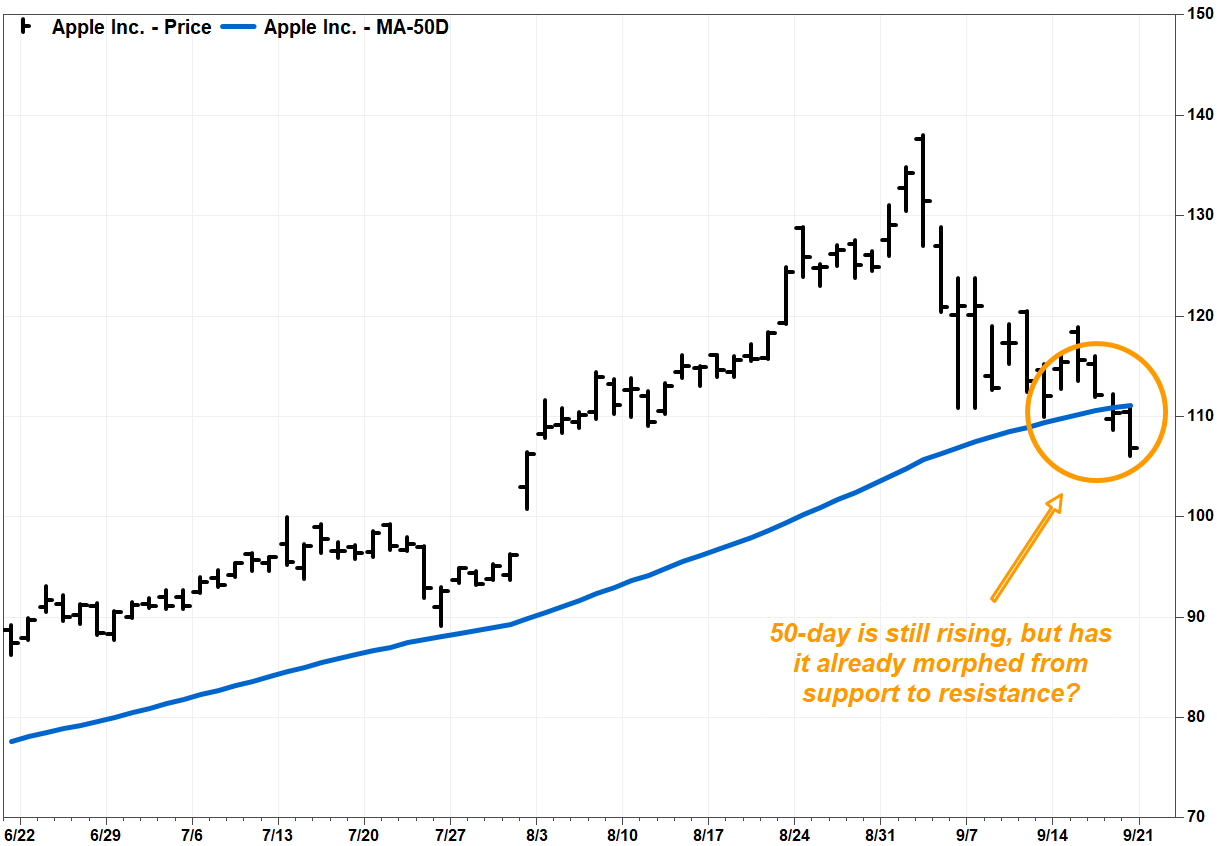
Apple’s stock closed below its 50-DMA on Thursday for the first time since April 21, then accelerated lower with a 3.2% drop on Friday to a seven-week low.
With the stock down 17.2% so far this month, it was on track for the biggest monthly decline since it tumbled 18.4% in November 2018.
The triple-Qs closed below the fund’s 50-DMA on Friday for the second straight day, and for the third time last week. While the 50-DMA was still rising, it won’t be for long. It was up just 0.094 points on Friday, after rising 0.207 points on Thursday and 0.360 points on Wednesday.
The QQQ has tumbled 9.5% so far in September and is currently heading toward the worst monthly performance since it dropped 11.5% in November 2008.
Meanwhile, the S&P 500 had dipped intraday below its 50-DMA last Monday and Thursday but recovered to close above it. The 50-DMA finally gave way on Friday, and the index closed below it for the first time since April 23. See Market Snapshot.
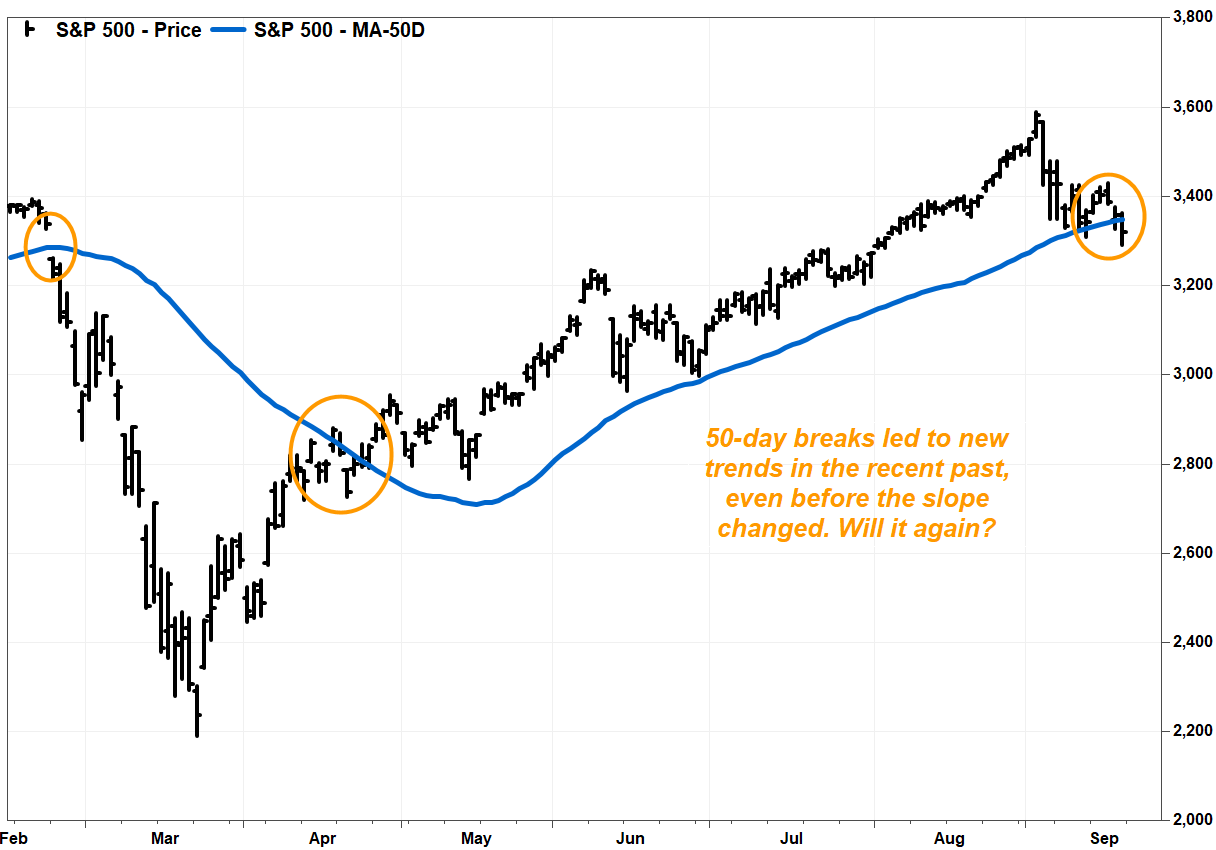
The 50-DMA is still sloping higher, but it has been flattening out, to an increase of 3.348 points on Friday from gains of 3.742 points on Thursday and 4.803 points on Thursday.
While this doesn’t necessarily scream sell for these stocks, it should give investors a reason for pause before they buy the dip.


