


The Nasdaq-100 just set a new record: Its 20-day simple moving average (SMA) has been rising for 89 consecutive days.
The prior record ended at 88 days on Feb. 21. We remember well because stocks went into free-fall thereafter.
I don’t want to paint a doomsday scenario based on a sample size of one, but — considering the March meltdown — we should ask:
Does this streak bear (pun intended) legitimate stock market risk?
Historical perspective
To gain objective historical perspective, I’ve identified the 12 longest rising 20-day SMA streaks for the Nasdaq-100. The individual and average forward performance, once the streak ended, is shown via the chart below. Here is what we learn:
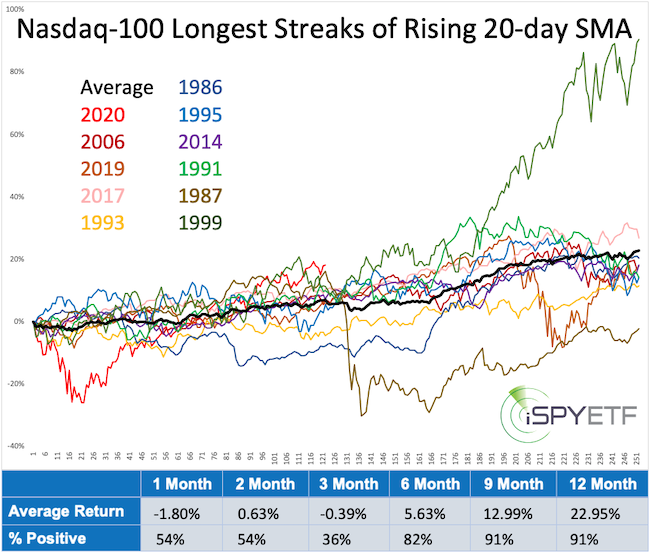
• 2020 was the worst-case scenario, but not the only loss.
• The average return one month later was -0.39%.
• Three months later, the Nasdaq-100 was down 64% of the time.
• Nine and 12 months later, the Nasdaq-100 was up 91% of the time with an average return of 12.99% and 22.95%.
This is yet another study to confirm that momentum doesn’t die easily. I wrote about this on July 14: “For Nasdaq-rally skeptics, remember that momentum doesn’t die easily.”
The above article featured a monthly Nasdaq chart with a 10-year trend channel and Fibonacci resistance (at 11,332 points).
Technical perspective
The daily chart below includes the Fibonacci resistance along with some other factors worth considering:
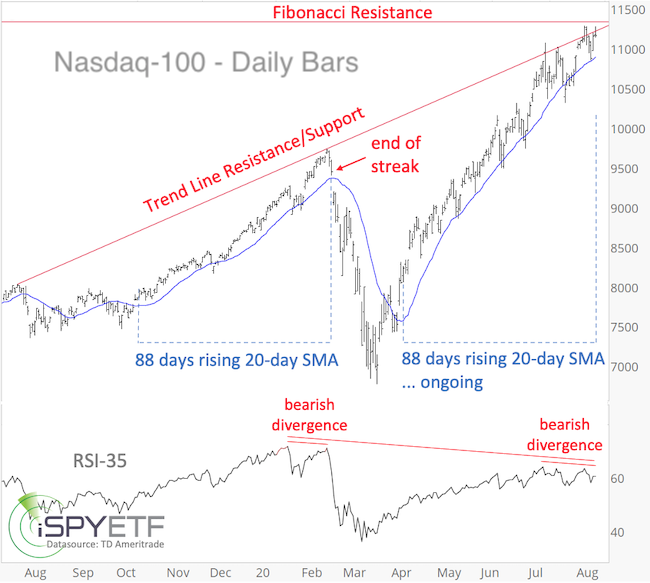
• Fibonacci resistance is enhanced by trend-line resistance.
• Corresponding Fibonacci resistance for the Invesco QQQ Trust QQQ, +0.06% is at 281.94.
• There was a bearish RSI-35 divergence (price made a new high, but RSI-35 did not) prior to the February 2020 peak. RSI (relative strength index) is a measure of momentum, and a divergence exists when price makes a new high, but RSI does not.
• There exists a bearish RSI-35 divergence between the July 20 and Aug. 6 high.
• There exists an even bigger RSI-35 divergence between the February and August highs.
• The 20-day SMA continues to rise.
• Long-term trend-channel resistance, shown in the July 14 article, is around 12,450.
Tug of war
There is a tug of war between bullish momentum and a potentially bearish technical setup. Investor sentiment has also become a headwind against higher prices.
In addition, the Dow Jones Industrial Average DJIA, +0.12% and Russell 2000 RUT, -0.08% have lagged behind the Nasdaq since the March low but outperformed the Nasdaq in August.
Apple AAPL, -0.24% and Amazon AMZN, -0.27% are trading above long-term support. The Nasdaq-100 and at least one of the above mega-cap powerhouses will have to fall below support to unlock lower price targets.
The Nasdaq has arrived at another potential inflection zone, and even though it has shattered every resistance level on its way here, it’s good not to become complacent and watch the above-mentioned levels.
Interestingly, the S&P 500 and SPDR S&P 500 Trust SPY, +0.12% are within striking distance of their February highs. Over the past 50 years, the S&P 500 lost 30% or more and recovered to within 2% of its prior all-time high only five other times.
On average, that round trip (all-time high, 30% or more decline, within 2% of prior all-time high) took 60 months. This time it took only six months. How the S&P 500 performed after having clawed its way back to where it is right now is discussed here.
Simon Maierhofer is the founder of iSPYETF and publisher of the Profit Radar Report.


