


The annual meeting of Berkshire Hathaway BRK.A, -0.63% BRK.B, -0.37% shareholders, presided over as always by its CEO and famed investor, Warren Buffett, came and went earlier this month. But we’re still being buffeted by critical commentary from pundits who say the legend’s legacy is “under pressure” due to Berkshire lagging behind the S&P 500 SPX, -0.28% in recent years.
For example, Randy Brown, a contributor to Forbes, asked on May 2: “Is Buffett losing his edge?” The great investor may have good long-term results, wrote Jeff Cox on the CNBC website, “But the question is whether in the current climate of short-termism and the demand for immediate results Buffett would last in the business if he didn’t already have his reputation.”
Are these comments fair to the fabled portfolio manager? The answer lies in Berkshire’s performance over the longer periods that actually make sense when evaluating investment portfolios.
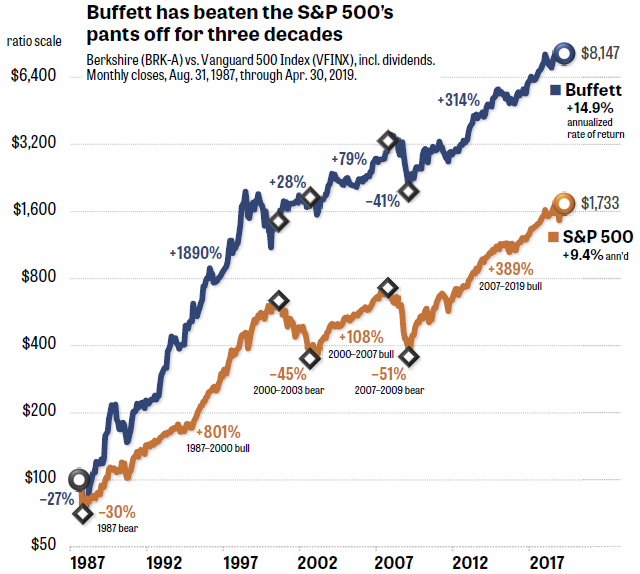
The accompanying graph shows that the rise of Berkshire’s share price in the past 32 years has been nothing short of phenomenal. Buffett has done what few investors of any size have been able to accomplish: He has beaten the S&P 500, including dividends, for many decades and by many, many percentage points.
If you had purchased $100 worth of Buffett’s stock, BRK-A, in August 1987, it would be worth more than $8,000 today. By contrast, $100 worth of the Vanguard Five Hundred Index mutual fund VFINX, -0.28% which tracks the S&P 500, would hand you back only about $1,700.
The S&P 500 index fund’s annualized return of 9.4% would have made a healthy contribution to your portfolio, to be sure (with a few horrible crashes along the way). But Buffett’s 14.9% return puts the index to shame.
The graph assumes that you reinvested the dividends from the S&P 500. Buffett believes his shareholders want capital gains, not dividends, so Berkshire hasn’t paid any out since 1967.
That’s one reason Berkshire’s share price is sky-high. In 1987, you could have bought one share of BRK-A for a mere 260 bucks. Today, a share will cost you over $300,000. Buffett had to set up a tracking stock in 1996, BRK-B, so small investors could buy shares for a tiny fraction of the big brother’s trading price. (Not incidentally, the lower-priced shares made it possible for Berkshire to be added in 2010 to the S&P 500 index. Standard & Poor’s requires that all stocks on the list have enough trading volume to provide liquidity.)
Let’s ask ourselves the unthinkable: What if Buffett’s performance was due to mere luck rather than skill? After all, out of 100,000 portfolio managers, someone would have to post the highest return, even if only by random chance.
Fortunately, statistical experts have put that possibility to rest. For instance, business professors from the American University and the University of Nevada studied 30 years of Buffett’s performance. “Berkshire Hathaway’s exceptional investment record,” the authors wrote, “is due to investment skill and not due to luck or as compensation for high risk.”
Despite his monumental achievement, the chatter about Buffett “slipping” still echoes around the internet based on only a few years of slightly lagging performance.
When we look at the business cycle of Main Street, and the market cycle of Wall Street, we see a different story. These ups and downs provide us with a fascinating look into Buffett’s investing technique, which few commentators ever write about.
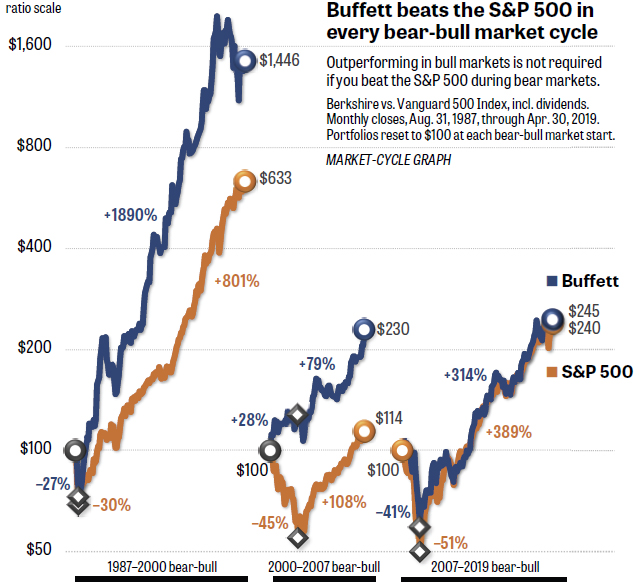
My second graph plots Berkshire’s performance vs. the S&P 500 over time periods that really matter. The shortest meaningful track record we should monitor is one bear-bull market cycle (and preferably more than one).
No politician will ever “solve” the business cycle’s habit of expanding and contracting employment. No economist will ever “cure” bear and bull markets. Euphoria and panic are baked into our human nature. Greed and fear will never be eliminated from our shared consciousness.
In the second graph, we can see that Buffett has outperformed the S&P 500 in all of the last three bear-bull market cycles. He had a phenomenal gain of 1890% in the 1987–2000 bull market. But that isn’t the reason for his enormous overall gain that we saw in the first graph. Buffett beat the market in the 2000–2007 and 2007–2019 cycles, as well.
What gets the pundits upset is that Buffett underperformed the S&P 500 in the 2002–2007 and 2009–2019 bull markets. But that’s an example of the very short-termism that CNBC’s Cox warned about.
Buffett made a gain of 79% in 2002–2007 and 314% in 2009–2019 (using month-end closes that represent the market’s bear-market lows and bull-market highs). Those gains are good, but the S&P 500 did even better, gaining 108% and 389%. The problem with commentators who look at the market this way is that they conveniently leave out the immediately preceding bear markets.
Berkshire lost only 41% in the 2007–2009 financial crisis, while the index fell 51%. In the 2000–2002 dot-com debacle, when the S&P 500 collapsed 45%, Buffett actually pulled off a gain of 28%. Without loading up on tech stocks, his diversified portfolio continued making profits.
The company is only barely beating the S&P 500 in the current 2007–2019 bear-bull cycle, but so what? Buffett is, in fact, still beating the index, which most hedge funds and actively managed mutual funds can’t claim. Starting from the beginning of the 2007 bear market, Buffett has turned $100 into $245. The S&P 500 turned it into just $240. That’s a win, and it doesn’t require any “fuzzy math.”
When have you ever read a pundit say that Buffett always outperforms bear markets and always (during the last 20 years) underperforms bull markets? This is a basic fact in Berkshire’s investment results. But we almost never hear about this clear pattern, which explains a lot.
Read: Here’s exactly where you should retire — based on what’s important to you
If you eliminate a portfolio’s performance in past bear markets, you reach a poor conclusion that’s unfair to you and unrealistic to any portfolio manager you may be evaluating. It’s not how much you make in bull markets that counts. It’s how much you keep in bear markets.
The combination of our bear- and bull-market experience is what determines our lifetime return on investment. Most individual investors underperform the market, because they get discouraged by large losses and pull out of equities near the bottom of bear markets. This leaves them mostly in cash when, without warning, a powerful bull-market train pulls out of the station.
Is Buffett deliberately trying to underperform the S&P 500 during bull markets, so his superior returns in bear markets can let him beat the index in the long-term? That’s highly doubtful. The next time I talk with him, I’ll ask.
That probably won’t be any time soon. The negativity around Berkshire’s annual meeting this month would discourage anyone, and it seems to have taken a toll. Asked for comment, Buffett’s assistant, Debbie Bosanek, said: “Mr. Buffett has to pass. He is just swamped with requests now and has asked me to turn down interview requests.”
My view is that Buffett is confident enough in his investing prowess that he doesn’t worry about beating the S&P 500 every year or even during entire bull markets. Any diversified portfolio is going to deviate from the index for substantial periods of time. The cushion that diversification gives you is meant to work over complete market cycles, not instantly.
How can individual investors take advantage of Buffett’s wisdom?
First of all, we can use it to quit beating ourselves up. If one of the most accomplished investors of our time doesn’t surpass the S&P 500 during bull markets, why should we mere mortals be expected to?
It isn’t reasonable to compare your personal portfolio against the S&P 500, which is almost entirely comprised of large-cap U.S. companies. As you can see in the above graphs, the index has subjected investors to three crashes—losses in the range of 30%, 40%, and 50%—just in the past three decades. Staying the course with a 100% equity portfolio through financial panics like those is hard for anyone to stomach.
It’s much better to accept a gradual rise in your portfolio’s balance during bull markets. You can then enjoy the outperformance that a balanced portfolio delivers during bear markets.
For us individual investors, long-term means the rest of our lives. Short-termism is a distraction. Stay focused on how well your portfolio did during complete market cycles, not calendar years. That requires a decade or more of patience—but it worked out for Buffett, and it can work out for you.
Want news about Europe delivered to your inbox? Subscribe to MarketWatch’s free Europe Daily newsletter. Sign up here.


