


So you’re an investor who believes in owning stocks for the long run.
You’ve more than tripled your money in 10 years by investing in broad U.S. stock market index funds, having weathered a potential double-dip recession (2010), the fiscal cliff (2012-2013), energy-bond volatility (2015) and a transition from presidents Obama to Trump (2016-2017). Nice work!
While inaction has been the best course of action since the bull market in U.S. stocks began in early 2009, the risks have now piled up. According to my research, there’s a chance of near-zero returns for most stocks during the next 10 years and a very high likelihood of a 50% collapse at some point.
How to track valuation
How did we get here? A question that’s been forgotten is, “Are you getting paid to take investing risks?” One way to find out is to track valuation, which used to be a key measure for investors, particularly value investors like me.
Valuation generally means taking into account fundamentals such as enterprise value, cash flow and earnings growth. Those gauges help to determine the present value of a company. If the present value is greater than the company’s stock value, there is a margin of safety for investors.
Volatility, defined by big swings in prices, can happen in either direction and at any time. If valuations are low enough, the long-term damage is negligible. Today, however, valuations are extremely elevated, putting investors in the danger zone.
Investors who need access to their money in the next 10 years should understand several irrefutable facts:
• There’s no guarantee stocks will return anything over a 10-year period. From 2000 to 2010, the U.S. stock market, as measured by the S&P 500 Index SPX, +0.16% of the largest publicly traded companies, had a negative return.
• The U.S. stock market now trades near all-time valuation highs on several metrics, as it did in 2000 before the dot-com crash.
• Valuations are one of the best predictors of long-term returns. (High valuations lead to low long-term returns, while low valuations are followed by high long-term returns.)
Risk tolerance
Worries and risks are a part of everyday life — and investing. To succeed in both, you must balance current conditions with your tolerance for risk.
Personally, my risk tolerance for shark bites is near zero, and as I remain a landlubber, my conditions are balanced with my risk tolerance. However, should I find myself swimming off the Atlantic coast of Florida while wearing a shark-bait suit and nursing several bleeding paper cuts, I have drastically increased my conditional risk far beyond my risk tolerance.
That’s perhaps a silly example, yet risk conditions in stocks change just as drastically but are much less obvious.
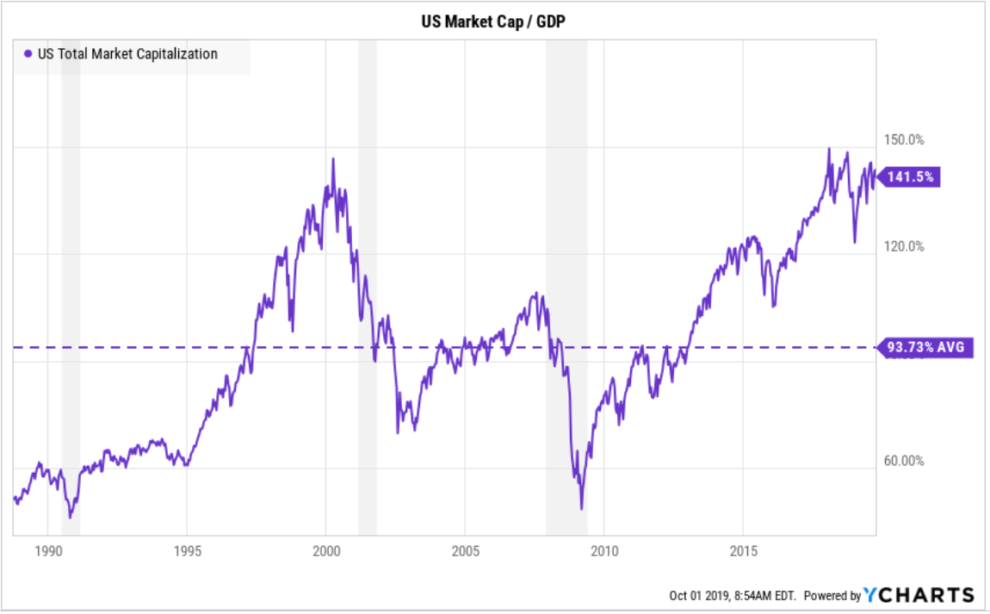
To illustrate the point, look at the following chart, which compares U.S. stock market capitalization (the value of all stocks) to gross domestic product, or GDP. It’s one of the best long-term indicators for U.S. stocks and a favorite of Warren Buffett. In fact, it’s called the Warren Buffett Indicator because the billionaire investor uses the metric to identify market peaks and troughs.

The chart shows how drastically valuation risk conditions change over the years. Most of the change is from the prices of stocks, not rising or falling GDP.
Before the past two major recessions (which began in 2001 and 2007), denoted by the gray bars, stocks traded at about 150% and 115% of GDP, respectively. After the ensuing bear markets, stocks bottomed out at around 40% to 60% lower.
Today, as you can see on the right side of the chart, the metric is above 140%, putting the valuation risk at extreme, shark-bite levels. We’re going to need a bigger boat.
Dot-com lesson
If you follow valuations, you need patience because they have little effect on short-term returns. The stock market has been above 125% of GDP for more than two years now, but the best investors don’t attempt to predict short-term moves in stocks, as changes can happen violently and without notice.
For example, look at the last time stocks were so richly valued, in 1999. The stock market plummeted well before the recession started in 2001. Therefore, valuation is an accurate guide for longer-term planning.
If your financial plan can’t handle volatility or low returns, it is an opportune time to back away from the broader market and explore stock picking and value investing.
Overbought equities
Valuations change risk conditions significantly over time. Stocks can fall temporarily, but longer-term periods of little or no returns are products of extreme valuations. Knowing the difference between the two is key.
When fear creeps up in the stock market, investors can safely ignore them if they paid a fair price for their positions. However, with today’s valuations, the risk of overpayment is among the highest in history.
Any little bump in the road, such as the U.S.-China trade war, European banks’ weakness or the domestic manufacturing slump, has the power to trigger a bear market. There’s a danger in ignoring leading recessionary indicators, such as factory reports and ultra-low bond yields, over the much-ballyhooed unemployment rate, a measure of the past.
If you’re averse to shark bites and high valuations with the potential to sink your financial plan, today is an opportunistic time to reexamine your risks.
Brian Frank is co-founder and CIO of Florida-based Frank Capital Partners LLC, and portfolio manager of the Frank Value Fund. Find him on Twitter @bfrankvalue.


