


How many of you owned Devon Energy in your retirement portfolios at the beginning of this year?
I ask because it is the best performer so far this year (through Nov. 15) among the stocks in the S&P 500, according to FactSet, with a gain of 186%. That compares to a gain of “just” 26.8% for the index itself.
Unless you were a gutsy contrarian, however, you most likely did not own Devon Energy DVN, -6.28% at the beginning of this year. That’s because the stock was one of the worst performers in 2020, with a loss of 35.3%.
Though Devon Energy’s rags-to-riches story is dramatic, it is not unique. Consider the 20 stocks with the worst 2020 returns in the S&P 500 index SPX, -0.14%. Their average year-to-date return is 68.1%, more than 40 percentage points ahead of the index itself. Other years’ results exhibit a similar pattern.
These results provide us with a powerful illustration of why it’s so hard to beat the market. You’ll likely lag a buy-and-hold if you fail to own more than just a couple of the Devon Energy’s in the market, and these are the very stocks you’re unlikely to have in your portfolio.
Skewness
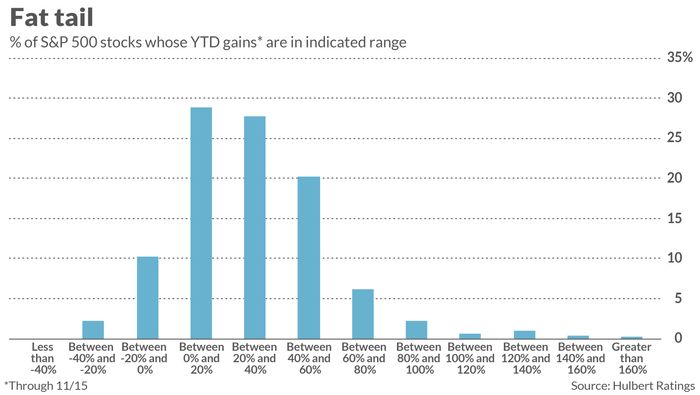
Notice that there are two factors at work here making it difficult to beat the market. On the one hand, there is the behavioral tendency to avoid betting on losers. On the other, the distribution of stock returns is heavily skewed, with a relatively few stocks providing a good chunk of the overall index’s returns.
To appreciate why skewness makes it difficult for stockpickers to beat a buy-and-hold, consider research conducted by Hendrik Bessembinder, a finance professor at Arizona State University. In a study that appeared in the Journal of Financial Economics in 2018, Bessembinder found that “the best-performing 4% of listed companies explain the net gain for the entire U.S. stock market since 1926.” The other 96% of stocks, on average, did no better than 90-day T-bills.
In other words, you faced a steep uphill battle to beat the market if you didn’t own those 4%, or even just a small number of them.
In a separate study, Bessembinder and colleagues found that non-U.S. stocks are even more skewed. Specifically, they found that “Outside the U.S., less than 1% of firms account for the $U.S. 16.0 trillion in net wealth creation [since 1990]. These results highlight the practical implications of the fact that the distribution of long-run stock returns is strongly positively skewed.”
Skewness becoming more extreme
I furthermore suspect that the skewness in stock market returns, already extreme, is becoming even more so. Consider a statistic known as “skewness,” which measures the extent to which a distribution differs from the traditional bell curve. Negative values indicate that there is a long left tail (more lower values than you’d otherwise expect), while positive skewness readings mean that there is a long right tail (more higher values than you’d otherwise expect).
Statisticians typically consider a reading above 1.0 to mean there is extreme positive skewness. As you can see from the table below, 2018’s reading was already above this threshold, and that it shot up in 2019 and then again in 2020. No doubt the extremely high readings for 2020 reflect the pandemic’s skewed impact on the market, but notice that 2019’s reading was already way above 2018’s already-high reading.
| Year | Skewness of return distribution of S&P 500 stocks |
| 2018 | 1.06 |
| 2019 | 5.30 |
| 2020 | 7.84 |
All of these statistics point to the same overall conclusion: Beating the market is extremely difficult. We already knew that, of course. But now we know why, and why it’s getting even harder.
Mark Hulbert is a regular contributor to MarketWatch. His Hulbert Ratings tracks investment newsletters that pay a flat fee to be audited. He can be reached at [email protected].


