


U.S. stocks have soared, but low trading volume suggests many investors got shaken out in March and have been sulking on the sidelines.
As the chart below shows, trading volume for the SPDR S&P 500 Trust SPY, -2.12%, which tracks the benchmark S&P 500 Index SPX, -2.19%, rose during the selloff and fell during the rally.
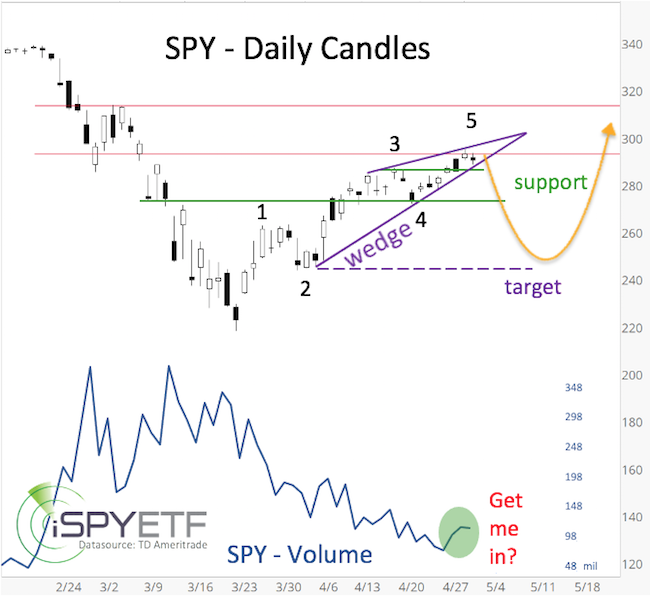
This is a sad reminder of investors’ tendency to sell during the worst of times and reluctance to buy during the best of times.
On March 26, near the height of fear, I said in the Profit Radar Report: “We anticipate a recovery toward 3,000 [points] for the S&P 500 over the next couple months and quite possibly new all-time highs in 2020.”
Unfortunately, most investors did not get to participate in this fast-and-furious rally. This may have started to change as there’s been a small volume spike in the past few days. Some investors may want to get back in on the action.
The question is: Is it too late to buy now?
At this point, I would not chase the remaining potential upside. That’s why I recommended April 29 to equip the stocks bought in March with stop-loss protection. Here is why:
1. The S&P 500 nearly reached my upside target of 3,000.
2. The SPDR S&P 500 Trust is “wedging” higher (chart above, see price action inside the purple lines). A wedge pattern is indicative of falling prices more often than not.
It is quite common for price to move back toward the beginning of the pattern (dashed purple line), which is as low as 245 for SPY and 2,450 for the S&P 500. However, it will take sustained trade below the upper green support line to activate the downside target. Until that happens, price can continue to move higher.
3. The advance from the March low can be counted as five waves. According to Elliott Wave theory, a complete five-wave rally should be followed by: 1. a sizable decline; 2. an eventual resumption of the rally to new recovery highs. The yellow arrow provides a rough idealized price projection.
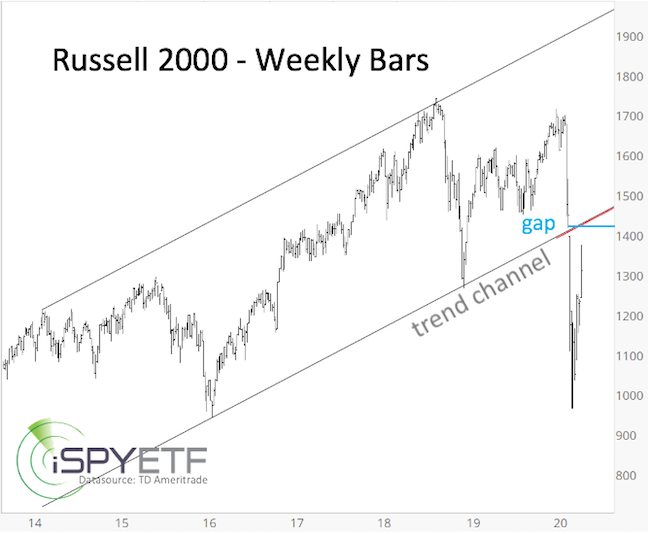
4. The Russell 2000 RUT, -3.54% has outperformed most major indexes, including the Nasdaq COMP, -2.35% and Dow Jones Industrial Average DJIA, -1.88%, for much of this week. However, this outperformance pushed the Russell 2000 and the iShares Russell 2000 ETF IWM, -3.81% close to a potent resistance level. The below chart and warning were published in the April 29 Profit Radar Report:
“There’s a massive open chart gap and trend channel resistance leading up to 141 for IWM. RSI-2 is over-bought and risk is increasing. A move above 140 over the next couple days looks like a good opportunity to go short, at least for a swing trade.”
The Federal Reserve is funneling unprecedented amounts of money into the stock market. If the S&P 500 can stay above support (2,890) or move back above support (after having fallen below), the Fed’s fire hose could trump the above-discussed factors.
Since the March lows, the iShares Russell 2000 ETF rallied as much as 43%, the SPDR Dow Jones Industrial Average Trust DIA, -1.78% as much as 36%, the SPDR S&P 500 Trust as much as 35.1% and the Invesco QQQ Trust QQQ, -1.95% as much as 33.4%.
This was the fastest rally from a 52-week low ever, but it’s probably gone too far, too fast. Now is not the time to be greedy, but to cash in gains and prepare for a buying opportunity at lower prices.
Simon Maierhofer is the founder of iSPYETF and publisher of the Profit Radar Report.


