


Stock market forecasting is somewhat similar to detective work. Every case is different: Some are clear and others are conflicting. And, of course, there’s no guarantee a case will be solved.
Regardless of the case (aka stock market setup), I go where the evidence leads me. And, yes, sometimes the evidence is clear, sometimes not.
In late March, with the S&P 500 Index SPX, +0.39% trading near 2,200 points, the evidence was fairly clear. That’s why I said in the March 26 Profit Radar Report: “We anticipate a recovery toward 3,000 for the S&P 500 over the next couple months.” More details about why stocks were like to rally: “Stock market breadth shows there might be light at the end of the tunnel.”
On April 29, the S&P 500 made it as high as 2,954 and the upside had become much less attractive. (See: “The stock market’s rebound is bullish, but a ‘too far, too fast’ danger lurks.”)
Not only did the upside become less attractive, the evidence about what’s next has also become more conflicting.
My “ideal” scenario is for the S&P 500 to test support at 2,500-2,600 before moving higher. Corresponding support for the SPDR S&P 500 Trust SPY, +0.46% is around 250-260.
Support for the Nasdaq Composite COMP, +0.79% is around 8,000, or 192 for the Invesco QQQ Trust QQQ, +0.64%. Support for the Dow Jones Industrial Average DJIA, +0.25% spans from 22,500-21,500 or 226-213 for the SPDR Dow Jones Industrial Average Trust DIA, +0.26%.
Again, I’d like to see those levels, if reached, act as a springboard to move prices higher.
The S&P 500 has been range-bound for the past month, and a stale market doesn’t provide many directional signals. Therefore, the “evidence” I’m about to show is more technical than usual. It’s not conclusive evidence, but it corroborates with my “ideal” scenario.
Option traders’ sentiment
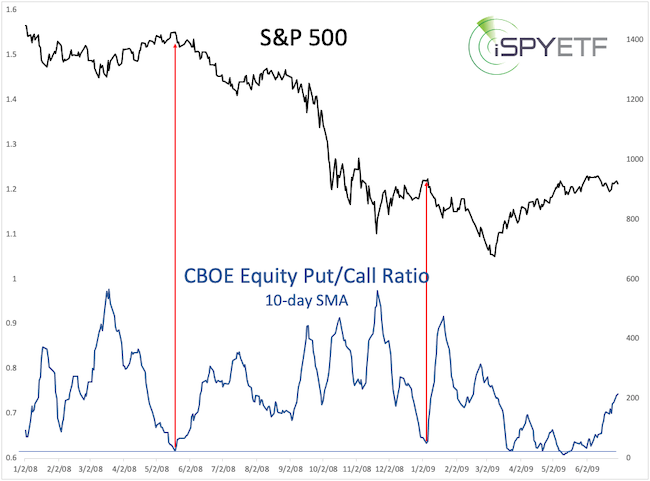
On May 11, the 10-day simple moving average (SMA) of the CBOE equity put/call ratio (which measures how many bullish call options are bought compared with bearish put options; low readings are a sign of complacency, high readings a sign of fear) fell below 0.60 after having soared above 0.98 in March.
There has never been such a big swing. However, in May 2008 and January 2009, the ratio cycled from above 0.97 to below 0.63. As the bold red arrows show, both times coincided with the end of bear market rallies.
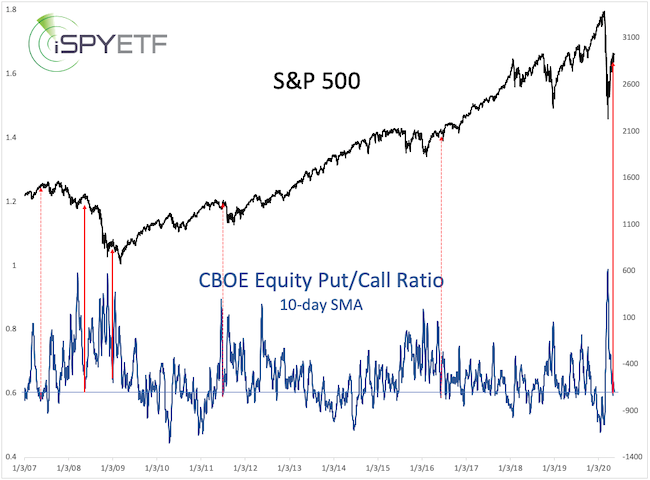
The dashed red arrows in the longer-term chart below highlight other, less extreme drops from tops. None of them was bullish for stocks.
Divergence of moving averages
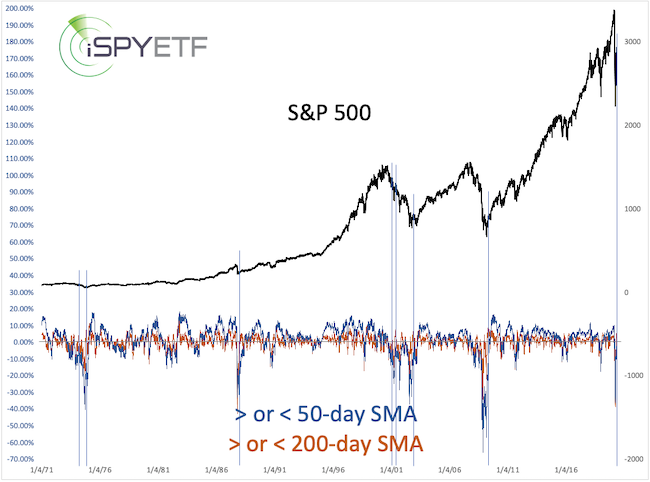
On May 11, the S&P 500 closed 6.85% above its 50-day SMA (orange line) but was still 2.43% below its 200-day SMA (blue line). It’s rare to see such a divergence. Since 1970, there were only eight other instances where the S&P 500 was more than 6.8% above its 50-day SMA but more than 2% below its 50-day SMA.
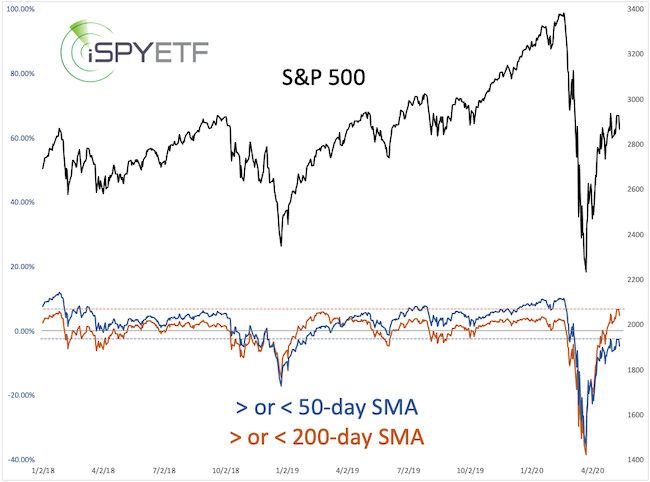
One month later, the S&P 500 was down five times. More troubling, however, is that the most similar cases occurred in May and November 2011, both of which led to further losses.
The next move
Despite the unprecedented nature of the 2020 stock market moves, my mix of indicators has done a surprisingly good job of identifying the next move.
The current evidence is not as clear as it’s been, but unless the major indexes break above their May highs, I expect more weakness to take hold next week (May 18-22), and I would seriously think about buying stocks again after a pullback of about 10%.
Simon Maierhofer is the founder of iSPYETF and publisher of the Profit Radar Report.


